

13 Modeling and Prediction of Choroidal Neovascularization …
373
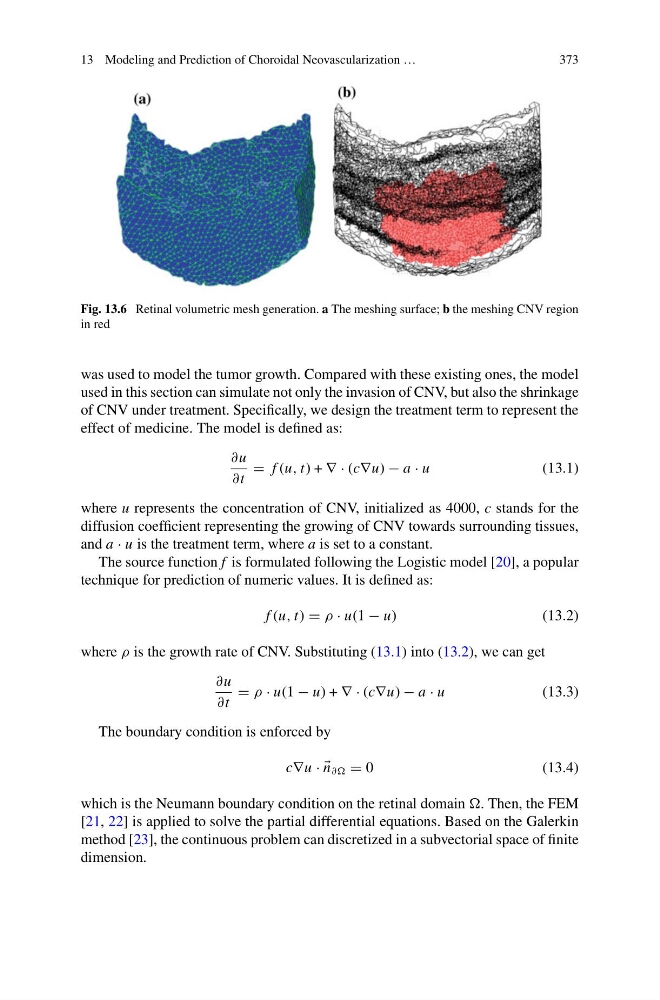
Fig. 13.6 Retinal volumetric mesh generation. a The meshing surface; b the meshing CNV region
in red
was used to model the tumor growth. Compared with these existing ones, the model
used in this section can simulate not only the invasion of CNV, but also the shrinkage
of CNV under treatment. Specifically, we design the treatment term to represent the
effect of medicine. The model is defined as:
∂u
∂t
f (u, t) + ∇ · (c∇u) − a · u
(13.1)
where u represents the concentration of CNV, initialized as 4000, c stands for the
diffusion coefficient representing the growing of CNV towards surrounding tissues,
and a · u is the treatment term, where a is set to a constant.
The source function f is formulated following the Logistic model [20], a popular
technique for prediction of numeric values. It is defined as:
f (u, t) ρ · u(1 − u)
(13.2)
where ρ is the growth rate of CNV. Substituting (13.1) into (13.2), we can get
∂u
∂t
ρ · u(1 − u) + ∇ · (c∇u) − a · u
(13.3)
The boundary condition is enforced by
c∇u · ·
n ∂∂ 0
(13.4)
which is the Neumann boundary condition on the retinal domain . Then, the FEM
[21, 22] is applied to solve the partial differential equations. Based on the Galerkin
method [23], the continuous problem can discretized in a subvectorial space of finite
dimension.
373
Fig. 13.6 Retinal volumetric mesh generation. a The meshing surface; b the meshing CNV region
in red
was used to model the tumor growth. Compared with these existing ones, the model
used in this section can simulate not only the invasion of CNV, but also the shrinkage
of CNV under treatment. Specifically, we design the treatment term to represent the
effect of medicine. The model is defined as:
∂u
∂t
f (u, t) + ∇ · (c∇u) − a · u
(13.1)
where u represents the concentration of CNV, initialized as 4000, c stands for the
diffusion coefficient representing the growing of CNV towards surrounding tissues,
and a · u is the treatment term, where a is set to a constant.
The source function f is formulated following the Logistic model [20], a popular
technique for prediction of numeric values. It is defined as:
f (u, t) ρ · u(1 − u)
(13.2)
where ρ is the growth rate of CNV. Substituting (13.1) into (13.2), we can get
∂u
∂t
ρ · u(1 − u) + ∇ · (c∇u) − a · u
(13.3)
The boundary condition is enforced by
c∇u · ·
n ∂∂ 0
(13.4)
which is the Neumann boundary condition on the retinal domain . Then, the FEM
[21, 22] is applied to solve the partial differential equations. Based on the Galerkin
method [23], the continuous problem can discretized in a subvectorial space of finite
dimension.