

306
Q. Chen et al.
with bilateral filtering [61]. The location of the retinal nerve fiber layer (RNFL)
is estimated by detecting the upper vitreous region. The purpose of detecting the
RNFL layer is to facilitate segmenting the RPE layer. The reflectivity of the vitreous
region is usually similar throughout the B-scans in an OCT cube, and thus a constant
threshold can be used to extract this background region, which helps identify the
contour of the surface of the RNFL. The bottom boundary of the vitreous region
is taken as the location of the inner limiting membrane and inner boundary of the
RNFL layer.
RPE layer can be identified in SD-OCT retinal images by its bright pixel values,
as shown in Fig. 11.16. Thus, intensity-based methods can be useful to extract it. In
addition, the healthy RPE has an approximately constant thickness (20 µm). Based
on this information and the histogram statistics of the image pixels underneath the
segmented RNFL (outside vitreous region), a threshold can be determined, which
separates the bright RPE region from the darker background to produce a binary
image forming an initial RPE estimation. A narrow band with a radius 20 µm (determined by approximate mean RPE thickness) is generated and the regions in the initial
estimation not connected with this band are later removed. The RPE layer segmentation is then further refined by removing small selected regions (regions containing
less than 150 pixels). To ensure that the RPE is a continuous linear structure, missing
pixels between selected regions are also interpolated. Finally, the middle axis of the
resulting RPE segmentation is computed for each A-scan (i.e., the individual axial
lines forming a B-scan) which produces the final RPE segmentation. Further details
are explained in [57].
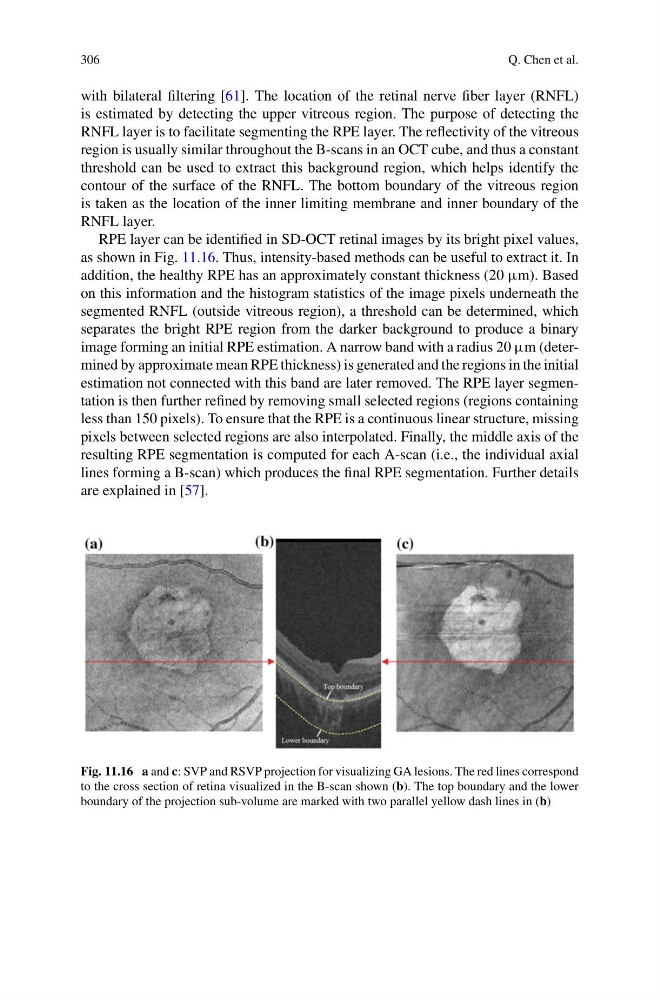
Fig. 11.16 a and c: SVP and RSVP projection for visualizing GA lesions. The red lines correspond
to the cross section of retina visualized in the B-scan shown (b). The top boundary and the lower
boundary of the projection sub-volume are marked with two parallel yellow dash lines in (b)
Q. Chen et al.
with bilateral filtering [61]. The location of the retinal nerve fiber layer (RNFL)
is estimated by detecting the upper vitreous region. The purpose of detecting the
RNFL layer is to facilitate segmenting the RPE layer. The reflectivity of the vitreous
region is usually similar throughout the B-scans in an OCT cube, and thus a constant
threshold can be used to extract this background region, which helps identify the
contour of the surface of the RNFL. The bottom boundary of the vitreous region
is taken as the location of the inner limiting membrane and inner boundary of the
RNFL layer.
RPE layer can be identified in SD-OCT retinal images by its bright pixel values,
as shown in Fig. 11.16. Thus, intensity-based methods can be useful to extract it. In
addition, the healthy RPE has an approximately constant thickness (20 µm). Based
on this information and the histogram statistics of the image pixels underneath the
segmented RNFL (outside vitreous region), a threshold can be determined, which
separates the bright RPE region from the darker background to produce a binary
image forming an initial RPE estimation. A narrow band with a radius 20 µm (determined by approximate mean RPE thickness) is generated and the regions in the initial
estimation not connected with this band are later removed. The RPE layer segmentation is then further refined by removing small selected regions (regions containing
less than 150 pixels). To ensure that the RPE is a continuous linear structure, missing
pixels between selected regions are also interpolated. Finally, the middle axis of the
resulting RPE segmentation is computed for each A-scan (i.e., the individual axial
lines forming a B-scan) which produces the final RPE segmentation. Further details
are explained in [57].
Fig. 11.16 a and c: SVP and RSVP projection for visualizing GA lesions. The red lines correspond
to the cross section of retina visualized in the B-scan shown (b). The top boundary and the lower
boundary of the projection sub-volume are marked with two parallel yellow dash lines in (b)