

258
F. Shi et al.
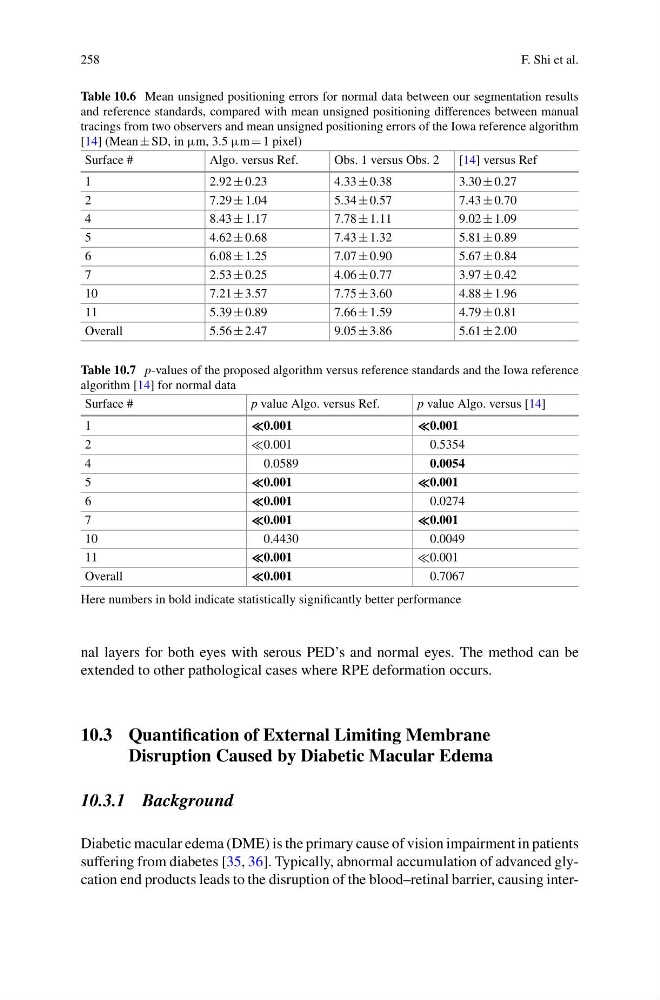
Table 10.6 Mean unsigned positioning errors for normal data between our segmentation results
and reference standards, compared with mean unsigned positioning differences between manual
tracings from two observers and mean unsigned positioning errors of the Iowa reference algorithm
[14] (Mean ± SD, in µm, 3.5 µm 1 pixel)
Surface #
Algo. versus Ref.
Obs. 1 versus Obs. 2
[14] versus Ref
1
2.92 ± 0.23
4.33 ± 0.38
3.30 ± 0.27
2
7.29 ± 1.04
5.34 ± 0.57
7.43 ± 0.70
4
8.43 ± 1.17
7.78 ± 1.11
9.02 ± 1.09
5
4.62 ± 0.68
7.43 ± 1.32
5.81 ± 0.89
6
6.08 ± 1.25
7.07 ± 0.90
5.67 ± 0.84
7
2.53 ± 0.25
4.06 ± 0.77
3.97 ± 0.42
10
7.21 ± 3.57
7.75 ± 3.60
4.88 ± 1.96
11
5.39 ± 0.89
7.66 ± 1.59
4.79 ± 0.81
Overall
5.56 ± 2.47
9.05 ± 3.86
5.61 ± 2.00
Table 10.7 p-values of the proposed algorithm versus reference standards and the Iowa reference
algorithm [14] for normal data
Surface #
p value Algo. versus Ref.
p value Algo. versus [14]
1
0.001
0.001
2
0.001
0.5354
4
0.0589
0.0054
5
0.001
0.001
6
0.001
0.0274
7
0.001
0.001
10
0.4430
0.0049
11
0.001
0.001
Overall
0.001
0.7067
Here numbers in bold indicate statistically significantly better performance
nal layers for both eyes with serous PED’s and normal eyes. The method can be
extended to other pathological cases where RPE deformation occurs.
10.3 Quantification of External Limiting Membrane
Disruption Caused by Diabetic Macular Edema
10.3.1 Background
Diabetic macular edema (DME) is the primary cause of vision impairment in patients
suffering from diabetes [35, 36]. Typically, abnormal accumulation of advanced glycation end products leads to the disruption of the blood–retinal barrier, causing inter-
F. Shi et al.
Table 10.6 Mean unsigned positioning errors for normal data between our segmentation results
and reference standards, compared with mean unsigned positioning differences between manual
tracings from two observers and mean unsigned positioning errors of the Iowa reference algorithm
[14] (Mean ± SD, in µm, 3.5 µm 1 pixel)
Surface #
Algo. versus Ref.
Obs. 1 versus Obs. 2
[14] versus Ref
1
2.92 ± 0.23
4.33 ± 0.38
3.30 ± 0.27
2
7.29 ± 1.04
5.34 ± 0.57
7.43 ± 0.70
4
8.43 ± 1.17
7.78 ± 1.11
9.02 ± 1.09
5
4.62 ± 0.68
7.43 ± 1.32
5.81 ± 0.89
6
6.08 ± 1.25
7.07 ± 0.90
5.67 ± 0.84
7
2.53 ± 0.25
4.06 ± 0.77
3.97 ± 0.42
10
7.21 ± 3.57
7.75 ± 3.60
4.88 ± 1.96
11
5.39 ± 0.89
7.66 ± 1.59
4.79 ± 0.81
Overall
5.56 ± 2.47
9.05 ± 3.86
5.61 ± 2.00
Table 10.7 p-values of the proposed algorithm versus reference standards and the Iowa reference
algorithm [14] for normal data
Surface #
p value Algo. versus Ref.
p value Algo. versus [14]
1
0.001
0.001
2
0.001
0.5354
4
0.0589
0.0054
5
0.001
0.001
6
0.001
0.0274
7
0.001
0.001
10
0.4430
0.0049
11
0.001
0.001
Overall
0.001
0.7067
Here numbers in bold indicate statistically significantly better performance
nal layers for both eyes with serous PED’s and normal eyes. The method can be
extended to other pathological cases where RPE deformation occurs.
10.3 Quantification of External Limiting Membrane
Disruption Caused by Diabetic Macular Edema
10.3.1 Background
Diabetic macular edema (DME) is the primary cause of vision impairment in patients
suffering from diabetes [35, 36]. Typically, abnormal accumulation of advanced glycation end products leads to the disruption of the blood–retinal barrier, causing inter-