

194
M. Wu et al.
in 2-D color fundus photographs. However, manual planimetry has been proven
time-consuming and is wrought with interobserver variability [3, 4]. With the introduction of spectral-domain optical coherence tomography (SD-OCT), which is a
high-resolution cross-section and noncontact imaging technology, it is possible to
image the ONH in a 3-D manner, enabling a more detailed quantification of its
structure and possible changes [5].
(a)
(b)
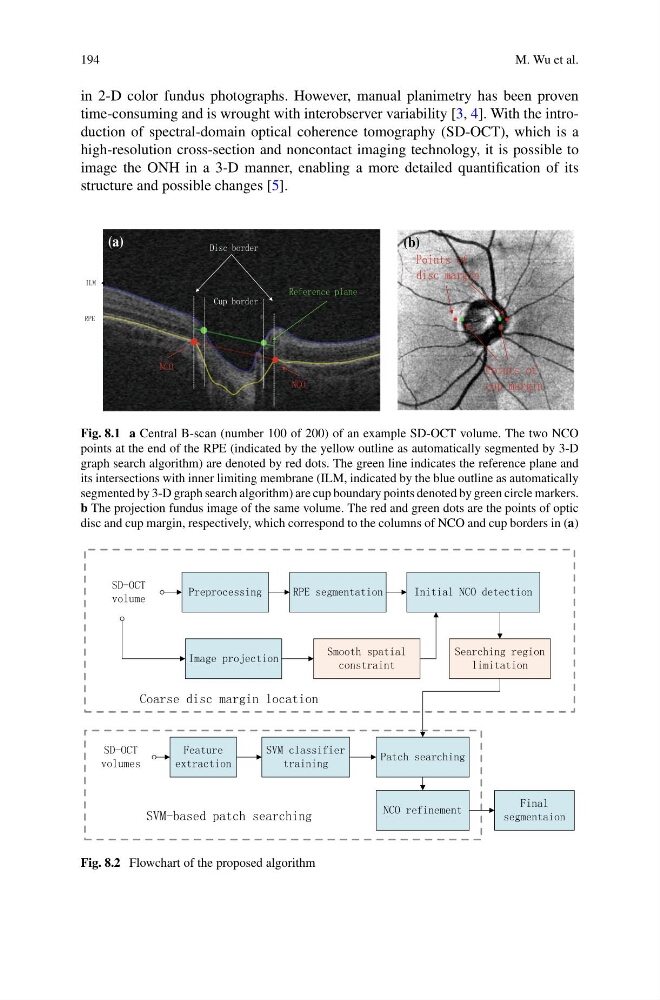
Fig. 8.1 a Central B-scan (number 100 of 200) of an example SD-OCT volume. The two NCO
points at the end of the RPE (indicated by the yellow outline as automatically segmented by 3-D
graph search algorithm) are denoted by red dots. The green line indicates the reference plane and
its intersections with inner limiting membrane (ILM, indicated by the blue outline as automatically
segmented by 3-D graph search algorithm) are cup boundary points denoted by green circle markers.
b The projection fundus image of the same volume. The red and green dots are the points of optic
disc and cup margin, respectively, which correspond to the columns of NCO and cup borders in (a)
Fig. 8.2 Flowchart of the proposed algorithm
M. Wu et al.
in 2-D color fundus photographs. However, manual planimetry has been proven
time-consuming and is wrought with interobserver variability [3, 4]. With the introduction of spectral-domain optical coherence tomography (SD-OCT), which is a
high-resolution cross-section and noncontact imaging technology, it is possible to
image the ONH in a 3-D manner, enabling a more detailed quantification of its
structure and possible changes [5].
(a)
(b)
Fig. 8.1 a Central B-scan (number 100 of 200) of an example SD-OCT volume. The two NCO
points at the end of the RPE (indicated by the yellow outline as automatically segmented by 3-D
graph search algorithm) are denoted by red dots. The green line indicates the reference plane and
its intersections with inner limiting membrane (ILM, indicated by the blue outline as automatically
segmented by 3-D graph search algorithm) are cup boundary points denoted by green circle markers.
b The projection fundus image of the same volume. The red and green dots are the points of optic
disc and cup margin, respectively, which correspond to the columns of NCO and cup borders in (a)
Fig. 8.2 Flowchart of the proposed algorithm