

178
E. Gao et al.
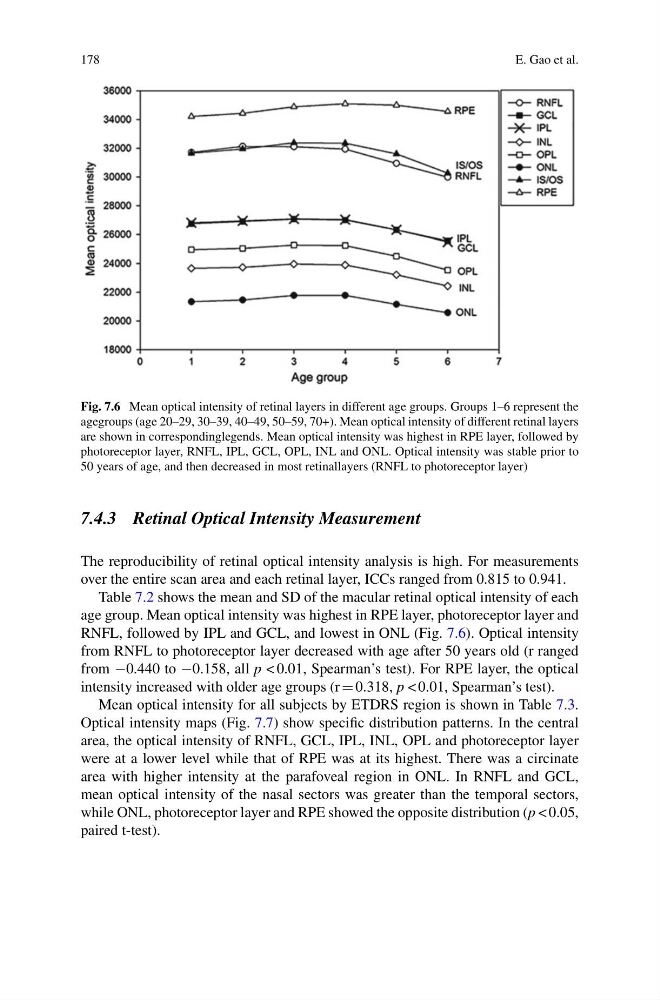
Fig. 7.6 Mean optical intensity of retinal layers in different age groups. Groups 1–6 represent the
agegroups (age 20–29, 30–39, 40–49, 50–59, 70+). Mean optical intensity of different retinal layers
are shown in correspondinglegends. Mean optical intensity was highest in RPE layer, followed by
photoreceptor layer, RNFL, IPL, GCL, OPL, INL and ONL. Optical intensity was stable prior to
50 years of age, and then decreased in most retinallayers (RNFL to photoreceptor layer)
7.4.3 Retinal Optical Intensity Measurement
The reproducibility of retinal optical intensity analysis is high. For measurements
over the entire scan area and each retinal layer, ICCs ranged from 0.815 to 0.941.
Table 7.2 shows the mean and SD of the macular retinal optical intensity of each
age group. Mean optical intensity was highest in RPE layer, photoreceptor layer and
RNFL, followed by IPL and GCL, and lowest in ONL (Fig. 7.6). Optical intensity
from RNFL to photoreceptor layer decreased with age after 50 years old (r ranged
from −0.440 to −0.158, all p < 0.01, Spearman’s test). For RPE layer, the optical
intensity increased with older age groups (r 0.318, p < 0.01, Spearman’s test).
Mean optical intensity for all subjects by ETDRS region is shown in Table 7.3.
Optical intensity maps (Fig. 7.7) show specific distribution patterns. In the central
area, the optical intensity of RNFL, GCL, IPL, INL, OPL and photoreceptor layer
were at a lower level while that of RPE was at its highest. There was a circinate
area with higher intensity at the parafoveal region in ONL. In RNFL and GCL,
mean optical intensity of the nasal sectors was greater than the temporal sectors,
while ONL, photoreceptor layer and RPE showed the opposite distribution (p < 0.05,
paired t-test).
E. Gao et al.
Fig. 7.6 Mean optical intensity of retinal layers in different age groups. Groups 1–6 represent the
agegroups (age 20–29, 30–39, 40–49, 50–59, 70+). Mean optical intensity of different retinal layers
are shown in correspondinglegends. Mean optical intensity was highest in RPE layer, followed by
photoreceptor layer, RNFL, IPL, GCL, OPL, INL and ONL. Optical intensity was stable prior to
50 years of age, and then decreased in most retinallayers (RNFL to photoreceptor layer)
7.4.3 Retinal Optical Intensity Measurement
The reproducibility of retinal optical intensity analysis is high. For measurements
over the entire scan area and each retinal layer, ICCs ranged from 0.815 to 0.941.
Table 7.2 shows the mean and SD of the macular retinal optical intensity of each
age group. Mean optical intensity was highest in RPE layer, photoreceptor layer and
RNFL, followed by IPL and GCL, and lowest in ONL (Fig. 7.6). Optical intensity
from RNFL to photoreceptor layer decreased with age after 50 years old (r ranged
from −0.440 to −0.158, all p < 0.01, Spearman’s test). For RPE layer, the optical
intensity increased with older age groups (r 0.318, p < 0.01, Spearman’s test).
Mean optical intensity for all subjects by ETDRS region is shown in Table 7.3.
Optical intensity maps (Fig. 7.7) show specific distribution patterns. In the central
area, the optical intensity of RNFL, GCL, IPL, INL, OPL and photoreceptor layer
were at a lower level while that of RPE was at its highest. There was a circinate
area with higher intensity at the parafoveal region in ONL. In RNFL and GCL,
mean optical intensity of the nasal sectors was greater than the temporal sectors,
while ONL, photoreceptor layer and RPE showed the opposite distribution (p < 0.05,
paired t-test).