

7 Quantitative Analysis of Retinal Layers’ Optical Intensities …
177
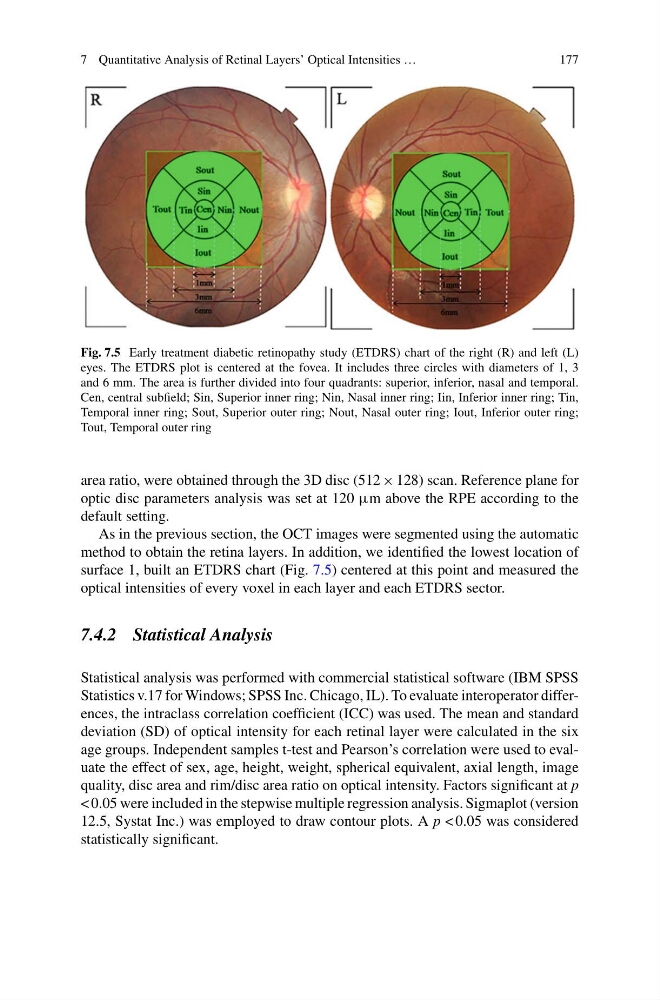
Fig. 7.5 Early treatment diabetic retinopathy study (ETDRS) chart of the right (R) and left (L)
eyes. The ETDRS plot is centered at the fovea. It includes three circles with diameters of 1, 3
and 6 mm. The area is further divided into four quadrants: superior, inferior, nasal and temporal.
Cen, central subfield; Sin, Superior inner ring; Nin, Nasal inner ring; Iin, Inferior inner ring; Tin,
Temporal inner ring; Sout, Superior outer ring; Nout, Nasal outer ring; Iout, Inferior outer ring;
Tout, Temporal outer ring
area ratio, were obtained through the 3D disc (512 × 128) scan. Reference plane for
optic disc parameters analysis was set at 120 μm above the RPE according to the
default setting.
As in the previous section, the OCT images were segmented using the automatic
method to obtain the retina layers. In addition, we identified the lowest location of
surface 1, built an ETDRS chart (Fig. 7.5) centered at this point and measured the
optical intensities of every voxel in each layer and each ETDRS sector.
7.4.2 Statistical Analysis
Statistical analysis was performed with commercial statistical software (IBM SPSS
Statistics v.17 for Windows; SPSS Inc. Chicago, IL). To evaluate interoperator differences, the intraclass correlation coefficient (ICC) was used. The mean and standard
deviation (SD) of optical intensity for each retinal layer were calculated in the six
age groups. Independent samples t-test and Pearson’s correlation were used to evaluate the effect of sex, age, height, weight, spherical equivalent, axial length, image
quality, disc area and rim/disc area ratio on optical intensity. Factors significant at p
< 0.05 were included in the stepwise multiple regression analysis. Sigmaplot (version
12.5, Systat Inc.) was employed to draw contour plots. A p < 0.05 was considered
statistically significant.
177
Fig. 7.5 Early treatment diabetic retinopathy study (ETDRS) chart of the right (R) and left (L)
eyes. The ETDRS plot is centered at the fovea. It includes three circles with diameters of 1, 3
and 6 mm. The area is further divided into four quadrants: superior, inferior, nasal and temporal.
Cen, central subfield; Sin, Superior inner ring; Nin, Nasal inner ring; Iin, Inferior inner ring; Tin,
Temporal inner ring; Sout, Superior outer ring; Nout, Nasal outer ring; Iout, Inferior outer ring;
Tout, Temporal outer ring
area ratio, were obtained through the 3D disc (512 × 128) scan. Reference plane for
optic disc parameters analysis was set at 120 μm above the RPE according to the
default setting.
As in the previous section, the OCT images were segmented using the automatic
method to obtain the retina layers. In addition, we identified the lowest location of
surface 1, built an ETDRS chart (Fig. 7.5) centered at this point and measured the
optical intensities of every voxel in each layer and each ETDRS sector.
7.4.2 Statistical Analysis
Statistical analysis was performed with commercial statistical software (IBM SPSS
Statistics v.17 for Windows; SPSS Inc. Chicago, IL). To evaluate interoperator differences, the intraclass correlation coefficient (ICC) was used. The mean and standard
deviation (SD) of optical intensity for each retinal layer were calculated in the six
age groups. Independent samples t-test and Pearson’s correlation were used to evaluate the effect of sex, age, height, weight, spherical equivalent, axial length, image
quality, disc area and rim/disc area ratio on optical intensity. Factors significant at p
< 0.05 were included in the stepwise multiple regression analysis. Sigmaplot (version
12.5, Systat Inc.) was employed to draw contour plots. A p < 0.05 was considered
statistically significant.