

112
F. Rathke et al.
Optimization. We minimize (5.15) with respect to the parameters of q b and the
discrete distributions q c;k, j and q c;k∧k−1, j . Since the factorization (5.10) decouples
q c and q b , these optimizations can be carried out independently. Recall that q c has a
tree-structure in each image column, thus can be optimized using the sum-product
algorithm, e.g. [24, Chap. 8.4.4]. The optimization with respect to ¯
μ and is given in
closed form. Details about the optimization of q b can be found in Section “Optimization with Respect to q b ” in Appendix. Both subproblems are strictly convex, thus
by alternatingly optimizing with respect to q b and q c , the functional J (q b , q c ), being
bounded from below over the feasible set of variables, is guaranteed to converge to
some local minimum.
To initialize the optimization, we set q b to a uniform distribution. Afterwards we
initialize q b given q c and iteratively optimize until convergence.
5.3 Results
5.3.1 Segmentation Performance
5.3.1.1 Datasets
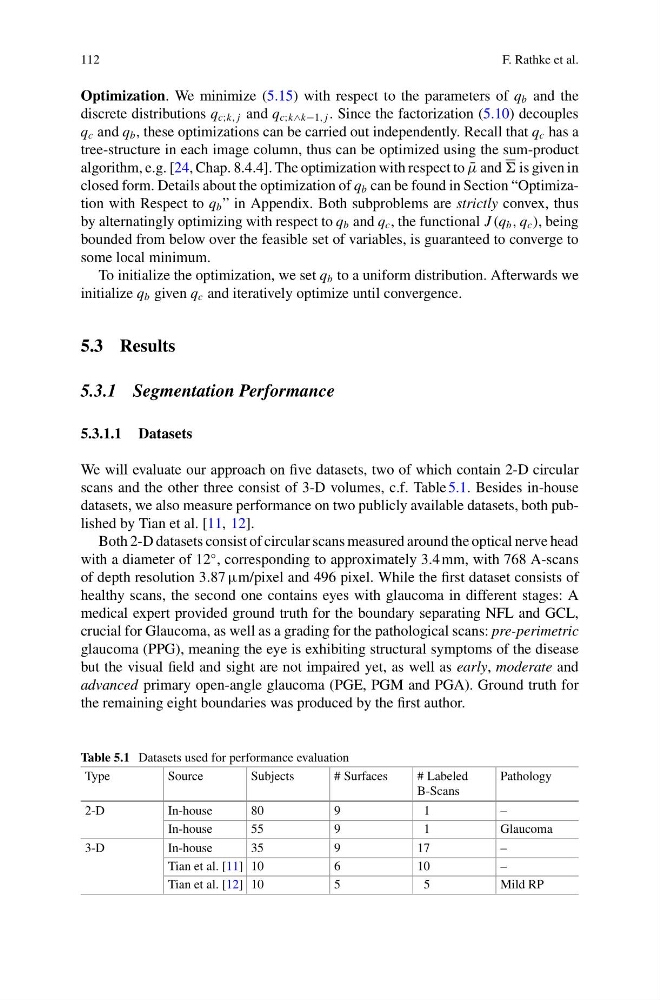
We will evaluate our approach on five datasets, two of which contain 2-D circular
scans and the other three consist of 3-D volumes, c.f. Table 5.1. Besides in-house
datasets, we also measure performance on two publicly available datasets, both published by Tian et al. [11, 12].
Both 2-D datasets consist of circular scans measured around the optical nerve head
with a diameter of 12
◦ , corresponding to approximately 3.4 mm, with 768 A-scans
of depth resolution 3.87 µm/pixel and 496 pixel. While the first dataset consists of
healthy scans, the second one contains eyes with glaucoma in different stages: A
medical expert provided ground truth for the boundary separating NFL and GCL,
crucial for Glaucoma, as well as a grading for the pathological scans: pre-perimetric
glaucoma (PPG), meaning the eye is exhibiting structural symptoms of the disease
but the visual field and sight are not impaired yet, as well as early, moderate and
advanced primary open-angle glaucoma (PGE, PGM and PGA). Ground truth for
the remaining eight boundaries was produced by the first author.
Table 5.1 Datasets used for performance evaluation
Type
Source
Subjects
# Surfaces
# Labeled
B-Scans
Pathology
2-D
In-house
80
9
1
–
In-house
55
9
1
Glaucoma
3-D
In-house
35
9
17
–
Tian et al. [11] 10
6
10
–
Tian et al. [12] 10
5
5
Mild RP
F. Rathke et al.
Optimization. We minimize (5.15) with respect to the parameters of q b and the
discrete distributions q c;k, j and q c;k∧k−1, j . Since the factorization (5.10) decouples
q c and q b , these optimizations can be carried out independently. Recall that q c has a
tree-structure in each image column, thus can be optimized using the sum-product
algorithm, e.g. [24, Chap. 8.4.4]. The optimization with respect to ¯
μ and is given in
closed form. Details about the optimization of q b can be found in Section “Optimization with Respect to q b ” in Appendix. Both subproblems are strictly convex, thus
by alternatingly optimizing with respect to q b and q c , the functional J (q b , q c ), being
bounded from below over the feasible set of variables, is guaranteed to converge to
some local minimum.
To initialize the optimization, we set q b to a uniform distribution. Afterwards we
initialize q b given q c and iteratively optimize until convergence.
5.3 Results
5.3.1 Segmentation Performance
5.3.1.1 Datasets
We will evaluate our approach on five datasets, two of which contain 2-D circular
scans and the other three consist of 3-D volumes, c.f. Table 5.1. Besides in-house
datasets, we also measure performance on two publicly available datasets, both published by Tian et al. [11, 12].
Both 2-D datasets consist of circular scans measured around the optical nerve head
with a diameter of 12
◦ , corresponding to approximately 3.4 mm, with 768 A-scans
of depth resolution 3.87 µm/pixel and 496 pixel. While the first dataset consists of
healthy scans, the second one contains eyes with glaucoma in different stages: A
medical expert provided ground truth for the boundary separating NFL and GCL,
crucial for Glaucoma, as well as a grading for the pathological scans: pre-perimetric
glaucoma (PPG), meaning the eye is exhibiting structural symptoms of the disease
but the visual field and sight are not impaired yet, as well as early, moderate and
advanced primary open-angle glaucoma (PGE, PGM and PGA). Ground truth for
the remaining eight boundaries was produced by the first author.
Table 5.1 Datasets used for performance evaluation
Type
Source
Subjects
# Surfaces
# Labeled
B-Scans
Pathology
2-D
In-house
80
9
1
–
In-house
55
9
1
Glaucoma
3-D
In-house
35
9
17
–
Tian et al. [11] 10
6
10
–
Tian et al. [12] 10
5
5
Mild RP