

D.2
one-dimensional ACF along the fast scanning axis (x) is usually used:
The one-dimensional HHCF is given by
To determine ℓ c , Gaussian functions can be fitted to the ACF and the HHCF. They are
given by
respectively. The correlation length is then the length at which the (fitted) ACF has
decayed to 1/e of its highest value. Instead of applying Eq. (D.1) directly, the rms
roughness can also be obtained by fitting Gaussian functions to the ACF and/or the HHCF.
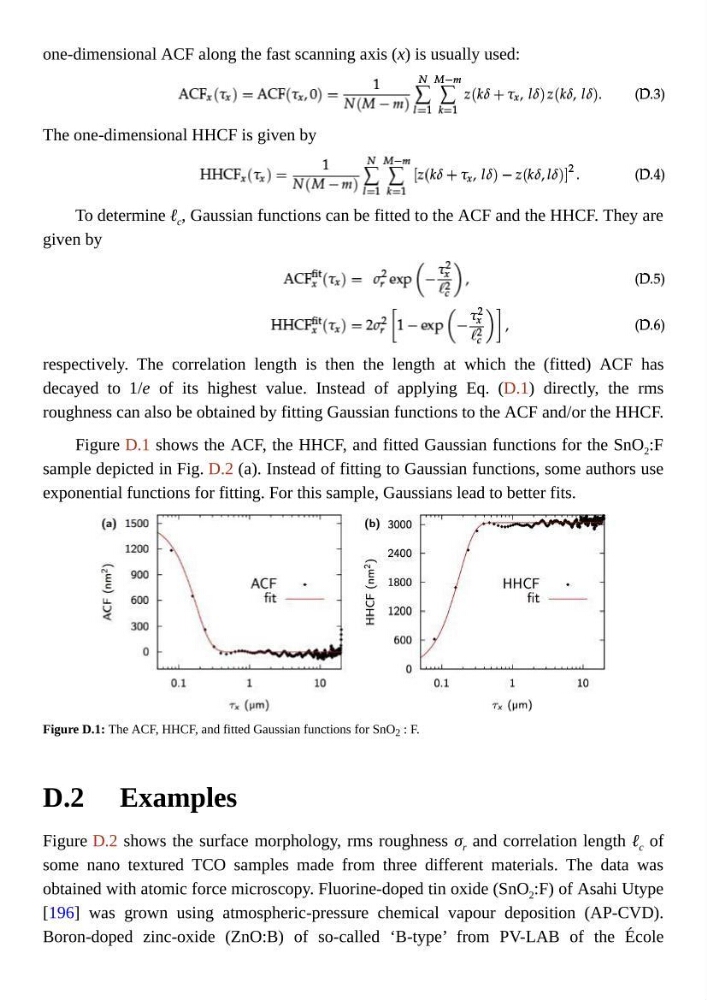
Figure D.1 shows the ACF, the HHCF, and fitted Gaussian functions for the SnO 2 :F
sample depicted in Fig. D.2 (a). Instead of fitting to Gaussian functions, some authors use
exponential functions for fitting. For this sample, Gaussians lead to better fits.
Figure D.1: The ACF, HHCF, and fitted Gaussian functions for SnO 2 : F.
Examples
Figure D.2 shows the surface morphology, rms roughness σ r and correlation length ℓ c of
some nano textured TCO samples made from three different materials. The data was
obtained with atomic force microscopy. Fluorine-doped tin oxide (SnO 2 :F) of Asahi Utype
[196] was grown using atmospheric-pressure chemical vapour deposition (AP-CVD).
Boron-doped zinc-oxide (ZnO:B) of so-called ‘B-type’ from PV-LAB of the École
one-dimensional ACF along the fast scanning axis (x) is usually used:
The one-dimensional HHCF is given by
To determine ℓ c , Gaussian functions can be fitted to the ACF and the HHCF. They are
given by
respectively. The correlation length is then the length at which the (fitted) ACF has
decayed to 1/e of its highest value. Instead of applying Eq. (D.1) directly, the rms
roughness can also be obtained by fitting Gaussian functions to the ACF and/or the HHCF.
Figure D.1 shows the ACF, the HHCF, and fitted Gaussian functions for the SnO 2 :F
sample depicted in Fig. D.2 (a). Instead of fitting to Gaussian functions, some authors use
exponential functions for fitting. For this sample, Gaussians lead to better fits.
Figure D.1: The ACF, HHCF, and fitted Gaussian functions for SnO 2 : F.
Examples
Figure D.2 shows the surface morphology, rms roughness σ r and correlation length ℓ c of
some nano textured TCO samples made from three different materials. The data was
obtained with atomic force microscopy. Fluorine-doped tin oxide (SnO 2 :F) of Asahi Utype
[196] was grown using atmospheric-pressure chemical vapour deposition (AP-CVD).
Boron-doped zinc-oxide (ZnO:B) of so-called ‘B-type’ from PV-LAB of the École