

costs of production over a long period of time. Depending on the number of variables that
are to be taken into account, calculating the LCoE can become very complex. In a simple
case the LCoE can be determined with
The sums expand across the whole lifetime of the system n, and every year accounts for
one summand. I t are the investment expenditures in the year t, M t are the operational and
maintenance expenditures in the year t, and F t are the fuel expenditures in the year t. Of
course, for PV F t ≡ 0. Further, E t is the electricity yield in the year t. Finally, r is the
discount rate which is a factor used to discount future costs and translate them into the
present value.
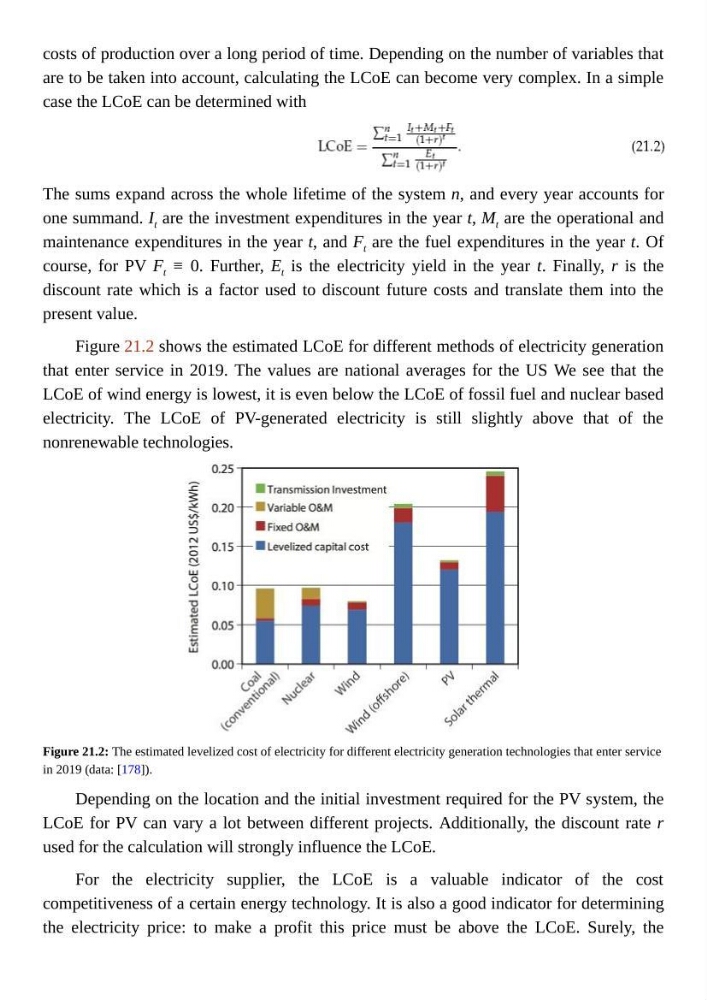
Figure 21.2 shows the estimated LCoE for different methods of electricity generation
that enter service in 2019. The values are national averages for the US We see that the
LCoE of wind energy is lowest, it is even below the LCoE of fossil fuel and nuclear based
electricity. The LCoE of PV-generated electricity is still slightly above that of the
nonrenewable technologies.
Figure 21.2: The estimated levelized cost of electricity for different electricity generation technologies that enter service
in 2019 (data: [178]).
Depending on the location and the initial investment required for the PV system, the
LCoE for PV can vary a lot between different projects. Additionally, the discount rate r
used for the calculation will strongly influence the LCoE.
For the electricity supplier, the LCoE is a valuable indicator of the cost
competitiveness of a certain energy technology. It is also a good indicator for determining
the electricity price: to make a profit this price must be above the LCoE. Surely, the
are to be taken into account, calculating the LCoE can become very complex. In a simple
case the LCoE can be determined with
The sums expand across the whole lifetime of the system n, and every year accounts for
one summand. I t are the investment expenditures in the year t, M t are the operational and
maintenance expenditures in the year t, and F t are the fuel expenditures in the year t. Of
course, for PV F t ≡ 0. Further, E t is the electricity yield in the year t. Finally, r is the
discount rate which is a factor used to discount future costs and translate them into the
present value.
Figure 21.2 shows the estimated LCoE for different methods of electricity generation
that enter service in 2019. The values are national averages for the US We see that the
LCoE of wind energy is lowest, it is even below the LCoE of fossil fuel and nuclear based
electricity. The LCoE of PV-generated electricity is still slightly above that of the
nonrenewable technologies.
Figure 21.2: The estimated levelized cost of electricity for different electricity generation technologies that enter service
in 2019 (data: [178]).
Depending on the location and the initial investment required for the PV system, the
LCoE for PV can vary a lot between different projects. Additionally, the discount rate r
used for the calculation will strongly influence the LCoE.
For the electricity supplier, the LCoE is a valuable indicator of the cost
competitiveness of a certain energy technology. It is also a good indicator for determining
the electricity price: to make a profit this price must be above the LCoE. Surely, the