

that in the band diagram the Fermi energy is constant across the junction, not the vacuum
energy. As the Fermi energy denotes the “filling level” of electrons, this is the level that is
constant throughout the junction. To visualize this, we take a look at Fig. 8.4 a), which
shows two tubes of different lengths that are partially filled with water. The filling level is
equivalent to the Fermi energy in a solid state material. The vacuum energy would be the
upper boundary of the tube; if the water was elevated above this level, it could leave the
tube. If the two tubes are connected as illustrated in Fig. 8.4 b), the water level in both
tubes will be the same. However, the length of the tubes might be different; for leaving the
first tube, a different energy can be required than for leaving the second tube.
Figure 8.4: (a) Two tubes of different length (upper boundary represents vacuum level) and filling level (representing
Fermi energy). (b) If the tubes are connected, the filling level will equalize but the heights of the tube boundaries can be
different.
In addition to the Fermi energy being constant across the junction, the band-edge
energies E C and E V as well as the vacuum energy E vac must be continuous. Hence, the
bands get bended, which indicates the presence of an electric field in this region. Due to
the electric field a difference in the electrostatic potential is created between the
boundaries of the space-charge region. Across the depletion region the changes in the
carrier concentration are compensated by changes in the electrostatic potential. The
electrostatic-potential profile ψ is also drawn in Fig. 8.3 b).
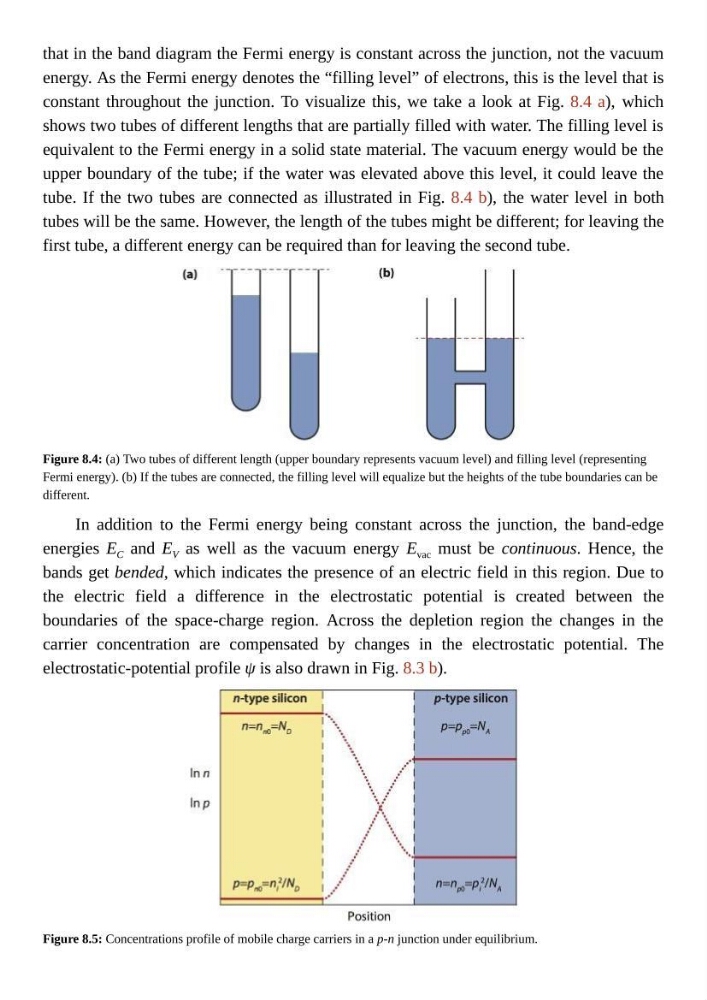
Figure 8.5: Concentrations profile of mobile charge carriers in a p-n junction under equilibrium.
energy. As the Fermi energy denotes the “filling level” of electrons, this is the level that is
constant throughout the junction. To visualize this, we take a look at Fig. 8.4 a), which
shows two tubes of different lengths that are partially filled with water. The filling level is
equivalent to the Fermi energy in a solid state material. The vacuum energy would be the
upper boundary of the tube; if the water was elevated above this level, it could leave the
tube. If the two tubes are connected as illustrated in Fig. 8.4 b), the water level in both
tubes will be the same. However, the length of the tubes might be different; for leaving the
first tube, a different energy can be required than for leaving the second tube.
Figure 8.4: (a) Two tubes of different length (upper boundary represents vacuum level) and filling level (representing
Fermi energy). (b) If the tubes are connected, the filling level will equalize but the heights of the tube boundaries can be
different.
In addition to the Fermi energy being constant across the junction, the band-edge
energies E C and E V as well as the vacuum energy E vac must be continuous. Hence, the
bands get bended, which indicates the presence of an electric field in this region. Due to
the electric field a difference in the electrostatic potential is created between the
boundaries of the space-charge region. Across the depletion region the changes in the
carrier concentration are compensated by changes in the electrostatic potential. The
electrostatic-potential profile ψ is also drawn in Fig. 8.3 b).
Figure 8.5: Concentrations profile of mobile charge carriers in a p-n junction under equilibrium.