

229
Application of Sensemaking
order of all 20 SCDs was maintained to keep the context of the event. Two coders
were selected to apply the sensemaking data/ frame model to data chunks and to help
establish the decision-making process of the original operator during mishap. Once
each SCD was settled, both coders independently assigned it a final code. The two
coders selected were the author ( experienced in human factors application) and a
retired 911 emergency dispatch operator. Both coders were knowledgeable about the
sensemaking theory. Four codes listed in Table 13.6 were selected to gain insight into
IO-related activities mentioned in the mishap report.
All 20 SCDs were coded independently by both coders. To reconcile any differences and to form a consensus agreement on all codes, a teleconference between both
coders and the volunteer Predator operator was arranged. The SCDs from both coders were matched and disagreements on code assignment were discussed.
To access the coding reliability, the final results from both coders were compared
by calculating Cohen’s kappa and correlation coefficient. The results are in Table 13.7:
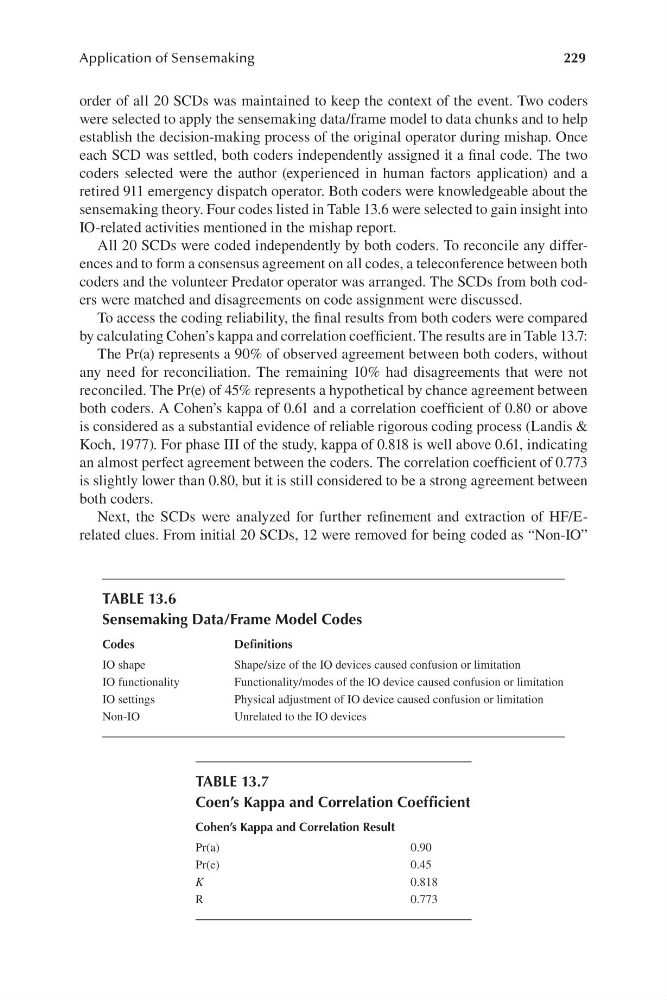
The Pr( a) represents a 90% of observed agreement between both coders, without
any need for reconciliation. The remaining 10% had disagreements that were not
reconciled. The Pr( e) of 45% represents a hypothetical by chance agreement between
both coders. A Cohen’s kappa of 0.61 and a correlation coefficient of 0.80 or above
is considered as a substantial evidence of reliable rigorous coding process ( Landis &
Koch, 1977). For phase III of the study, kappa of 0.818 is well above 0.61, indicating
an almost perfect agreement between the coders. The correlation coefficient of 0.773
is slightly lower than 0.80, but it is still considered to be a strong agreement between
both coders.
Next, the SCDs were analyzed for further refinement and extraction of HF/ E -
related clues. From initial 20 SCDs, 12 were removed for being coded as “ Non-IO”
TABLE 13.6
Sensemaking Data/ Frame Model Codes
Codes
Definitions
IO shape
Shape/ size of the IO devices caused confusion or limitation
IO functionality
Functionality/ modes of the IO device caused confusion or limitation
IO settings
Physical adjustment of IO device caused confusion or limitation
Non-IO
Unrelated to the IO devices
TABLE 13.7
Coen’s Kappa and Correlation Coefficient
Cohen’s Kappa and Correlation Result
Pr(a)
Pr(e)
K
0.90
0.45
0.818
R
0.773
Application of Sensemaking
order of all 20 SCDs was maintained to keep the context of the event. Two coders
were selected to apply the sensemaking data/ frame model to data chunks and to help
establish the decision-making process of the original operator during mishap. Once
each SCD was settled, both coders independently assigned it a final code. The two
coders selected were the author ( experienced in human factors application) and a
retired 911 emergency dispatch operator. Both coders were knowledgeable about the
sensemaking theory. Four codes listed in Table 13.6 were selected to gain insight into
IO-related activities mentioned in the mishap report.
All 20 SCDs were coded independently by both coders. To reconcile any differences and to form a consensus agreement on all codes, a teleconference between both
coders and the volunteer Predator operator was arranged. The SCDs from both coders were matched and disagreements on code assignment were discussed.
To access the coding reliability, the final results from both coders were compared
by calculating Cohen’s kappa and correlation coefficient. The results are in Table 13.7:
The Pr( a) represents a 90% of observed agreement between both coders, without
any need for reconciliation. The remaining 10% had disagreements that were not
reconciled. The Pr( e) of 45% represents a hypothetical by chance agreement between
both coders. A Cohen’s kappa of 0.61 and a correlation coefficient of 0.80 or above
is considered as a substantial evidence of reliable rigorous coding process ( Landis &
Koch, 1977). For phase III of the study, kappa of 0.818 is well above 0.61, indicating
an almost perfect agreement between the coders. The correlation coefficient of 0.773
is slightly lower than 0.80, but it is still considered to be a strong agreement between
both coders.
Next, the SCDs were analyzed for further refinement and extraction of HF/ E -
related clues. From initial 20 SCDs, 12 were removed for being coded as “ Non-IO”
TABLE 13.6
Sensemaking Data/ Frame Model Codes
Codes
Definitions
IO shape
Shape/ size of the IO devices caused confusion or limitation
IO functionality
Functionality/ modes of the IO device caused confusion or limitation
IO settings
Physical adjustment of IO device caused confusion or limitation
Non-IO
Unrelated to the IO devices
TABLE 13.7
Coen’s Kappa and Correlation Coefficient
Cohen’s Kappa and Correlation Result
Pr(a)
Pr(e)
K
0.90
0.45
0.818
R
0.773