

279
Petroleum Analysis
constituents as well as the molecular weights of the products as a means of understanding the process. For those original constituents and products, for example, resins and asphaltenes, that have
little or no volatility, vapor pressure osmometry (VPO) has been proven to be of considerable value
(Blondel-Telouk et al., 1995).
A particularly appropriate method involves the use of different solvents (at least two), and the
data are then extrapolated to infinite dilution. There has also been the use of different temperatures
for a particular solvent after which the data are extrapolated to room temperature (Speight et al.,
1985; Speight, 1987). In this manner, different solvents are employed and the molecular weight of
a petroleum fraction (particularly the asphaltenes) can be determined for which it can be assumed
that there is little or no influence from any intermolecular forces. In summary, the molecular weight
may be as close to the real value as possible.
In fact, it is strongly recommended that to negate concentration effects and temperature effects,
the molecular weight determination should be carried out at three different concentrations at three
different temperatures. The data for each temperature are then extrapolated to zero concentration
and the zero concentration data at each temperature are then extrapolated to room temperature
(Speight, 1987).
10.10 USE OF THE DATA
The data derived from the evaluation techniques described here can be employed to give the refiner
an indication of the means by which the crude feedstock should be processed as well as for the
prediction of product properties (Dolbear et al., 1987; Wallace and Carrigy, 1988). Other properties
(Table 10.1) may also be required for further feedstock evaluation, or, more likely, for comparison
between feedstocks even though they may not play any role in dictating which refinery operations
are necessary.
Nevertheless, it must be emphasized that to proceed from the raw evaluation data to full-scale
production is not the preferred step; further evaluation of the processability of the feedstock is usually necessary through the use of a pilot-scale operation. To take the evaluation of a feedstock one
step further, it may then be possible to develop correlations between the data obtained from the
actual plant operations (as well as the pilot plant data) with one or more of the physical properties
determined as part of the initial feedstock evaluation.
However, it is essential that when such data are derived, the parameters employed should be carefully specified. For example, the data presented in the tables were derived on the basis of straightrun residua having API gravity less than 18. The gas oil end point was of the order of 470°C–495°C
(875°F–925°F), the gasoline end point was 205°C (400°F), and the pressure in the coke drum was
standardized at 35–45 psi. Obviously there are benefits to the derivation of such specific data, but
the numerical values, although representing only an approximation, may vary substantially when
applied to different feedstocks (Speight, 1987).
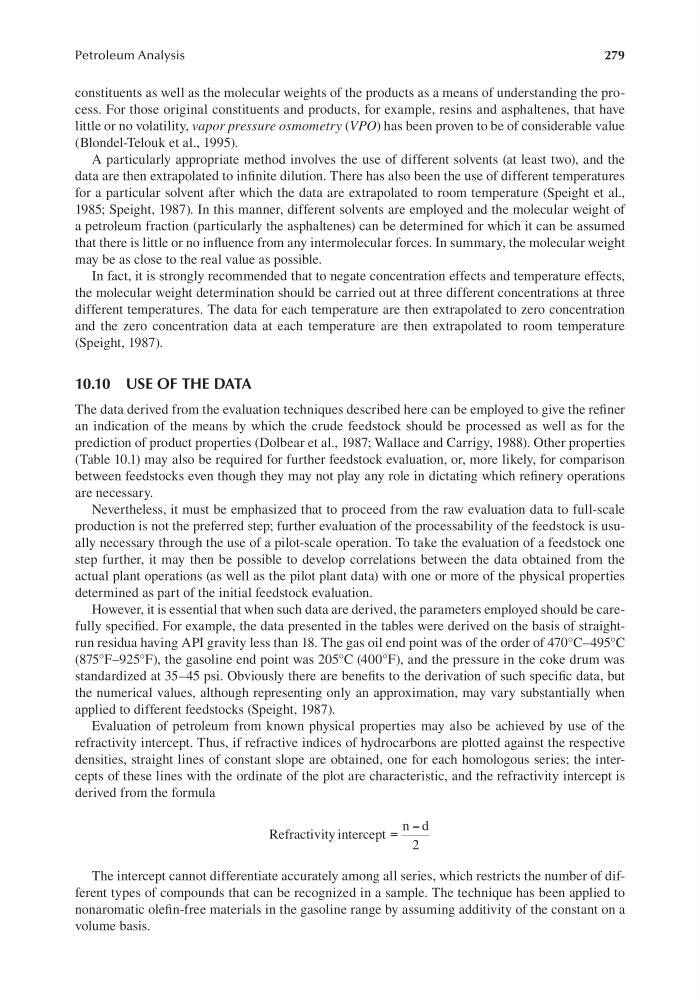
Evaluation of petroleum from known physical properties may also be achieved by use of the
refractivity intercept. Thus, if refractive indices of hydrocarbons are plotted against the respective
densities, straight lines of constant slope are obtained, one for each homologous series; the intercepts of these lines with the ordinate of the plot are characteristic, and the refractivity intercept is
derived from the formula
Refractivity intercept
n d
=
-
2
The intercept cannot differentiate accurately among all series, which restricts the number of different types of compounds that can be recognized in a sample. The technique has been applied to
nonaromatic olefin-free materials in the gasoline range by assuming additivity of the constant on a
volume basis.
Petroleum Analysis
constituents as well as the molecular weights of the products as a means of understanding the process. For those original constituents and products, for example, resins and asphaltenes, that have
little or no volatility, vapor pressure osmometry (VPO) has been proven to be of considerable value
(Blondel-Telouk et al., 1995).
A particularly appropriate method involves the use of different solvents (at least two), and the
data are then extrapolated to infinite dilution. There has also been the use of different temperatures
for a particular solvent after which the data are extrapolated to room temperature (Speight et al.,
1985; Speight, 1987). In this manner, different solvents are employed and the molecular weight of
a petroleum fraction (particularly the asphaltenes) can be determined for which it can be assumed
that there is little or no influence from any intermolecular forces. In summary, the molecular weight
may be as close to the real value as possible.
In fact, it is strongly recommended that to negate concentration effects and temperature effects,
the molecular weight determination should be carried out at three different concentrations at three
different temperatures. The data for each temperature are then extrapolated to zero concentration
and the zero concentration data at each temperature are then extrapolated to room temperature
(Speight, 1987).
10.10 USE OF THE DATA
The data derived from the evaluation techniques described here can be employed to give the refiner
an indication of the means by which the crude feedstock should be processed as well as for the
prediction of product properties (Dolbear et al., 1987; Wallace and Carrigy, 1988). Other properties
(Table 10.1) may also be required for further feedstock evaluation, or, more likely, for comparison
between feedstocks even though they may not play any role in dictating which refinery operations
are necessary.
Nevertheless, it must be emphasized that to proceed from the raw evaluation data to full-scale
production is not the preferred step; further evaluation of the processability of the feedstock is usually necessary through the use of a pilot-scale operation. To take the evaluation of a feedstock one
step further, it may then be possible to develop correlations between the data obtained from the
actual plant operations (as well as the pilot plant data) with one or more of the physical properties
determined as part of the initial feedstock evaluation.
However, it is essential that when such data are derived, the parameters employed should be carefully specified. For example, the data presented in the tables were derived on the basis of straightrun residua having API gravity less than 18. The gas oil end point was of the order of 470°C–495°C
(875°F–925°F), the gasoline end point was 205°C (400°F), and the pressure in the coke drum was
standardized at 35–45 psi. Obviously there are benefits to the derivation of such specific data, but
the numerical values, although representing only an approximation, may vary substantially when
applied to different feedstocks (Speight, 1987).
Evaluation of petroleum from known physical properties may also be achieved by use of the
refractivity intercept. Thus, if refractive indices of hydrocarbons are plotted against the respective
densities, straight lines of constant slope are obtained, one for each homologous series; the intercepts of these lines with the ordinate of the plot are characteristic, and the refractivity intercept is
derived from the formula
Refractivity intercept
n d
=
-
2
The intercept cannot differentiate accurately among all series, which restricts the number of different types of compounds that can be recognized in a sample. The technique has been applied to
nonaromatic olefin-free materials in the gasoline range by assuming additivity of the constant on a
volume basis.