

257
Petroleum Analysis
One of the main properties of petroleum that serves to indicate the comparative ease with which
the material can be refined is the volatility (Chapters 10 and 17). Investigation of the volatility
of petroleum is usually carried out under standard conditions, thereby allowing comparisons to
be made between data obtained from various laboratories. Thus, nondestructive distillation data
(US Bureau of Mines method) show that, not surprisingly, bitumen is a higher boiling material
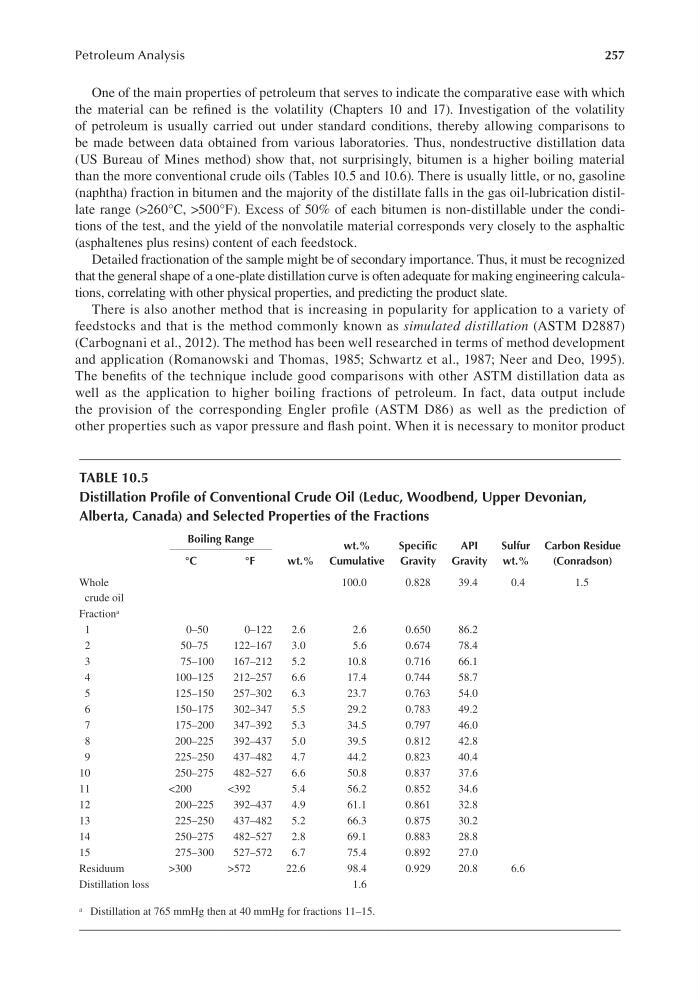
than the more conventional crude oils (Tables 10.5 and 10.6). There is usually little, or no, gasoline
(naphtha) fraction in bitumen and the majority of the distillate falls in the gas oil-lubrication distillate range (>260°C, >500°F). Excess of 50% of each bitumen is non-distillable under the conditions of the test, and the yield of the nonvolatile material corresponds very closely to the asphaltic
(asphaltenes plus resins) content of each feedstock.
Detailed fractionation of the sample might be of secondary importance. Thus, it must be recognized
that the general shape of a one-plate distillation curve is often adequate for making engineering calculations, correlating with other physical properties, and predicting the product slate.
There is also another method that is increasing in popularity for application to a variety of
feedstocks and that is the method commonly known as simulated distillation (ASTM D2887)
(Carbognani et al., 2012). The method has been well researched in terms of method development
and application (Romanowski and Thomas, 1985; Schwartz et al., 1987; Neer and Deo, 1995).
The benefits of the technique include good comparisons with other ASTM distillation data as
well as the application to higher boiling fractions of petroleum. In fact, data output include
the provision of the corresponding Engler profile (ASTM D86) as well as the prediction of
other properties such as vapor pressure and flash point. When it is necessary to monitor product
TABLE 10.5
Distillation Profile of Conventional Crude Oil (Leduc, Woodbend, Upper Devonian,
Alberta, Canada) and Selected Properties of the Fractions
Boiling Range
wt.%
wt.%
Cumulative
Specific
Gravity
API
Gravity
Sulfur
wt.%
Carbon Residue
(Conradson)
°C
°F
Whole
crude oil
100.0
0.828
39.4
0.4
1.5
Fraction a
1
0–50
0–122
2.6
2.6
0.650
86.2
2
50–75
122–167
3.0
5.6
0.674
78.4
3
75–100
167–212
5.2
10.8
0.716
66.1
4
100–125
212–257
6.6
17.4
0.744
58.7
5
125–150
257–302
6.3
23.7
0.763
54.0
6
150–175
302–347
5.5
29.2
0.783
49.2
7
175–200
347–392
5.3
34.5
0.797
46.0
8
200–225
392–437
5.0
39.5
0.812
42.8
9
225–250
437–482
4.7
44.2
0.823
40.4
10
250–275
482–527
6.6
50.8
0.837
37.6
11
<200
<392
5.4
56.2
0.852
34.6
12
200–225
392–437
4.9
61.1
0.861
32.8
13
225–250
437–482
5.2
66.3
0.875
30.2
14
250–275
482–527
2.8
69.1
0.883
28.8
15
275–300
527–572
6.7
75.4
0.892
27.0
Residuum
>300
>572
22.6
98.4
0.929
20.8
6.6
Distillation loss
1.6
a Distillation at 765 mmHg then at 40 mmHg for fractions 11–15.
Petroleum Analysis
One of the main properties of petroleum that serves to indicate the comparative ease with which
the material can be refined is the volatility (Chapters 10 and 17). Investigation of the volatility
of petroleum is usually carried out under standard conditions, thereby allowing comparisons to
be made between data obtained from various laboratories. Thus, nondestructive distillation data
(US Bureau of Mines method) show that, not surprisingly, bitumen is a higher boiling material
than the more conventional crude oils (Tables 10.5 and 10.6). There is usually little, or no, gasoline
(naphtha) fraction in bitumen and the majority of the distillate falls in the gas oil-lubrication distillate range (>260°C, >500°F). Excess of 50% of each bitumen is non-distillable under the conditions of the test, and the yield of the nonvolatile material corresponds very closely to the asphaltic
(asphaltenes plus resins) content of each feedstock.
Detailed fractionation of the sample might be of secondary importance. Thus, it must be recognized
that the general shape of a one-plate distillation curve is often adequate for making engineering calculations, correlating with other physical properties, and predicting the product slate.
There is also another method that is increasing in popularity for application to a variety of
feedstocks and that is the method commonly known as simulated distillation (ASTM D2887)
(Carbognani et al., 2012). The method has been well researched in terms of method development
and application (Romanowski and Thomas, 1985; Schwartz et al., 1987; Neer and Deo, 1995).
The benefits of the technique include good comparisons with other ASTM distillation data as
well as the application to higher boiling fractions of petroleum. In fact, data output include
the provision of the corresponding Engler profile (ASTM D86) as well as the prediction of
other properties such as vapor pressure and flash point. When it is necessary to monitor product
TABLE 10.5
Distillation Profile of Conventional Crude Oil (Leduc, Woodbend, Upper Devonian,
Alberta, Canada) and Selected Properties of the Fractions
Boiling Range
wt.%
wt.%
Cumulative
Specific
Gravity
API
Gravity
Sulfur
wt.%
Carbon Residue
(Conradson)
°C
°F
Whole
crude oil
100.0
0.828
39.4
0.4
1.5
Fraction a
1
0–50
0–122
2.6
2.6
0.650
86.2
2
50–75
122–167
3.0
5.6
0.674
78.4
3
75–100
167–212
5.2
10.8
0.716
66.1
4
100–125
212–257
6.6
17.4
0.744
58.7
5
125–150
257–302
6.3
23.7
0.763
54.0
6
150–175
302–347
5.5
29.2
0.783
49.2
7
175–200
347–392
5.3
34.5
0.797
46.0
8
200–225
392–437
5.0
39.5
0.812
42.8
9
225–250
437–482
4.7
44.2
0.823
40.4
10
250–275
482–527
6.6
50.8
0.837
37.6
11
<200
<392
5.4
56.2
0.852
34.6
12
200–225
392–437
4.9
61.1
0.861
32.8
13
225–250
437–482
5.2
66.3
0.875
30.2
14
250–275
482–527
2.8
69.1
0.883
28.8
15
275–300
527–572
6.7
75.4
0.892
27.0
Residuum
>300
>572
22.6
98.4
0.929
20.8
6.6
Distillation loss
1.6
a Distillation at 765 mmHg then at 40 mmHg for fractions 11–15.