

delivered in Bahasa. Then they were shown four objects on each slide. Those four objects were
displayed four times with the order of color displayed randomly to eliminate the tendency of looking
at the central point or from left to right. The four slides were displayed to the respondents for 10
seconds. This is based on the information of Rowan (2010) in Apsari (2012) that buyers generally
spend 10 seconds observing a product category in a supermarket display. Data collected were the
fixation amounts. Before starting the eye-tracking recording, the calibration was performed on
each respondent to detect the position of the user’s eye view on the monitor. This is to ensure the
data collected are valid.
This eye-tracking study was carried out in the Laboratory of Labor Design Analysis and
Ergonomics of the Industrial Engineering Study Program at Parahyangan University, Bandung,
Indonesia using hardware and software Tobi X2- 30 from Tobii Studio. The data collected were
the fixation counts which were the number of times the eye gaze paused in a spot within the AOI
(Bergstrom &Schall 2014) to investigate how often the areas were viewed. The data was then processed by displaying the AOI of each displayed image. The collected data were analyzed concerning
the average duration of fixation.
2.4 Data analysis
To analyze data, this study used independent sample T-tests and ANOVA to determine if there were
any differences in the color preference of a particular grouping variable, i.e., gender.
3 RESULT & DISCUSSION
3.1 Eye-tracking study
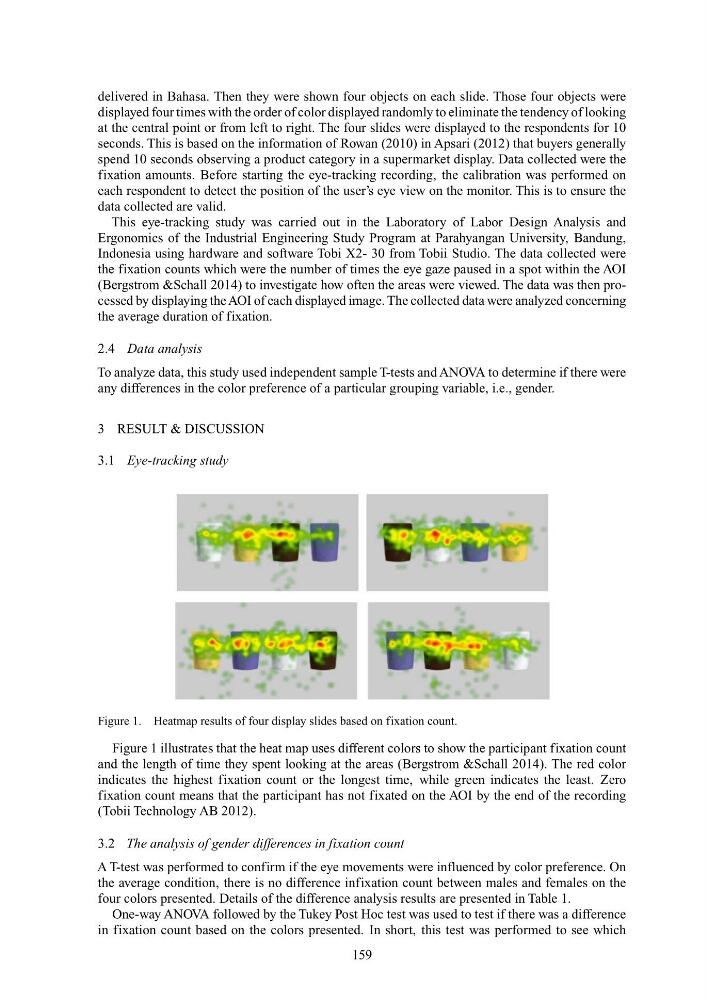
Figure 1. Heatmap results of four display slides based on fixation count.
Figure 1 illustrates that the heat map uses different colors to show the participant fixation count
and the length of time they spent looking at the areas (Bergstrom &Schall 2014). The red color
indicates the highest fixation count or the longest time, while green indicates the least. Zero
fixation count means that the participant has not fixated on the AOI by the end of the recording
(Tobii Technology AB 2012).
3.2 The analysis of gender differences in fixation count
A T-test was performed to confirm if the eye movements were influenced by color preference. On
the average condition, there is no difference infixation count between males and females on the
four colors presented. Details of the difference analysis results are presented in Table 1.
One-way ANOVA followed by the Tukey Post Hoc test was used to test if there was a difference
in fixation count based on the colors presented. In short, this test was performed to see which
159
displayed four times with the order of color displayed randomly to eliminate the tendency of looking
at the central point or from left to right. The four slides were displayed to the respondents for 10
seconds. This is based on the information of Rowan (2010) in Apsari (2012) that buyers generally
spend 10 seconds observing a product category in a supermarket display. Data collected were the
fixation amounts. Before starting the eye-tracking recording, the calibration was performed on
each respondent to detect the position of the user’s eye view on the monitor. This is to ensure the
data collected are valid.
This eye-tracking study was carried out in the Laboratory of Labor Design Analysis and
Ergonomics of the Industrial Engineering Study Program at Parahyangan University, Bandung,
Indonesia using hardware and software Tobi X2- 30 from Tobii Studio. The data collected were
the fixation counts which were the number of times the eye gaze paused in a spot within the AOI
(Bergstrom &Schall 2014) to investigate how often the areas were viewed. The data was then processed by displaying the AOI of each displayed image. The collected data were analyzed concerning
the average duration of fixation.
2.4 Data analysis
To analyze data, this study used independent sample T-tests and ANOVA to determine if there were
any differences in the color preference of a particular grouping variable, i.e., gender.
3 RESULT & DISCUSSION
3.1 Eye-tracking study
Figure 1. Heatmap results of four display slides based on fixation count.
Figure 1 illustrates that the heat map uses different colors to show the participant fixation count
and the length of time they spent looking at the areas (Bergstrom &Schall 2014). The red color
indicates the highest fixation count or the longest time, while green indicates the least. Zero
fixation count means that the participant has not fixated on the AOI by the end of the recording
(Tobii Technology AB 2012).
3.2 The analysis of gender differences in fixation count
A T-test was performed to confirm if the eye movements were influenced by color preference. On
the average condition, there is no difference infixation count between males and females on the
four colors presented. Details of the difference analysis results are presented in Table 1.
One-way ANOVA followed by the Tukey Post Hoc test was used to test if there was a difference
in fixation count based on the colors presented. In short, this test was performed to see which
159