

206 Beam-based Correction and Optimization for Accelerators
0
0.2
0.4
0.6
0.8
1
1.2
f 1 (x)
0
20
40
60
80
100
120
f
2
(x), Rosenbrock-4
NSGA-II, N=2000
=0.001
=0.01
=0.1
0
0.05
0.1
0.15
0.2
0.25
0.3
0.35
0.4
f 1 (x)
0
10
20
30
40
50
60
f
2
(x), Rosenbrock-4
MOPSO, N=2000
=0.001
=0.01
=0.1
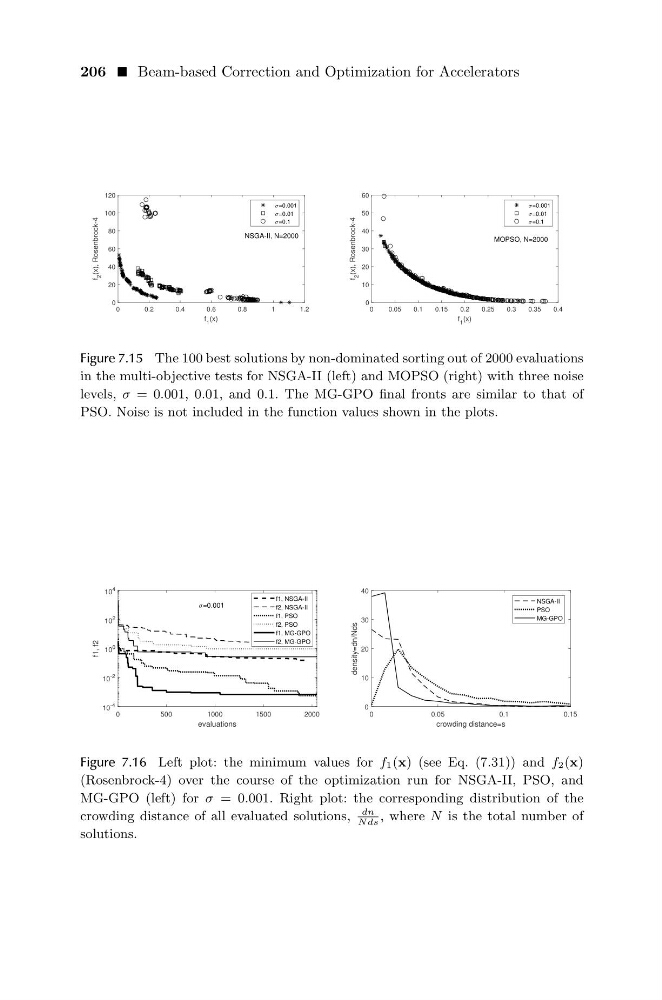
Figure 7.15 The 100 best solutions by non-dominated sorting out of 2000 evaluations
in the multi-objective tests for NSGA-II (left) and MOPSO (right) with three noise
levels, σ = 0.001, 0.01, and 0.1. The MG-GPO final fronts are similar to that of
PSO. Noise is not included in the function values shown in the plots.
0
500
1000
1500
2000
evaluations
10 -4
10 -2
10 0
10 2
10 4
f1, f2
=0.001
f1, NSGA-II
f2, NSGA-II
f1, PSO
f2, PSO
f1, MG-GPO
f2, MG-GPO
0
0.05
0.1
0.15
crowding distance=s
0
10
20
30
40
density=dn/Nds
NSGA-II
PSO
MG-GPO
Figure 7.16 Left plot: the minimum values for f1(x) (see Eq. (7.31)) and f2(x)
(Rosenbrock-4) over the course of the optimization run for NSGA-II, PSO, and
MG-GPO (left) for σ = 0.001. Right plot: the corresponding distribution of the
crowding distance of all evaluated solutions,
dn
N ds
, where N is the total number of
solutions.
0
0.2
0.4
0.6
0.8
1
1.2
f 1 (x)
0
20
40
60
80
100
120
f
2
(x), Rosenbrock-4
NSGA-II, N=2000
=0.001
=0.01
=0.1
0
0.05
0.1
0.15
0.2
0.25
0.3
0.35
0.4
f 1 (x)
0
10
20
30
40
50
60
f
2
(x), Rosenbrock-4
MOPSO, N=2000
=0.001
=0.01
=0.1
Figure 7.15 The 100 best solutions by non-dominated sorting out of 2000 evaluations
in the multi-objective tests for NSGA-II (left) and MOPSO (right) with three noise
levels, σ = 0.001, 0.01, and 0.1. The MG-GPO final fronts are similar to that of
PSO. Noise is not included in the function values shown in the plots.
0
500
1000
1500
2000
evaluations
10 -4
10 -2
10 0
10 2
10 4
f1, f2
=0.001
f1, NSGA-II
f2, NSGA-II
f1, PSO
f2, PSO
f1, MG-GPO
f2, MG-GPO
0
0.05
0.1
0.15
crowding distance=s
0
10
20
30
40
density=dn/Nds
NSGA-II
PSO
MG-GPO
Figure 7.16 Left plot: the minimum values for f1(x) (see Eq. (7.31)) and f2(x)
(Rosenbrock-4) over the course of the optimization run for NSGA-II, PSO, and
MG-GPO (left) for σ = 0.001. Right plot: the corresponding distribution of the
crowding distance of all evaluated solutions,
dn
N ds
, where N is the total number of
solutions.