

164 Beam-based Correction and Optimization for Accelerators
orbits are related to the RDTs. Each RDT drives a specific resonance and corresponds to a specific spectral line. Conversely, each resonance is driven by
many RDTs, which may come from different multipole fields through various
perturbation mechanisms. The strengths of the nonlinear RDTs depend on
the oscillation amplitudes to various orders of power according to the orders
of the RDTs. To effectively sample the nonlinear fields, the beam needs to
be excited to coherent oscillations with a relatively large amplitude. However,
when measuring the lower order RDTs, it is desirable to suppress the contributions of the higher order terms by using a moderate amplitude. In theory,
it is possible to determine the lower order RDTs and in turn the corresponding generating function terms, which are then used to remove the lower order
contributions to the spectral line in subsequent experiments with larger amplitudes, allowing the separation of the RDTs order by order [6]. In practice
this is very difficult as there would be considerable errors even in the lowest
order RDTs.
In experiments, it has been demonstrated that the leading order RDTs
by sextupoles and octupoles can be determined from the measured turn-byturn BPMs [40]. The spectral lines on the horizontal and vertical turn-byturn resonance basis orbits (i.e., h
−
x and h
−
y ) corresponding to the leading
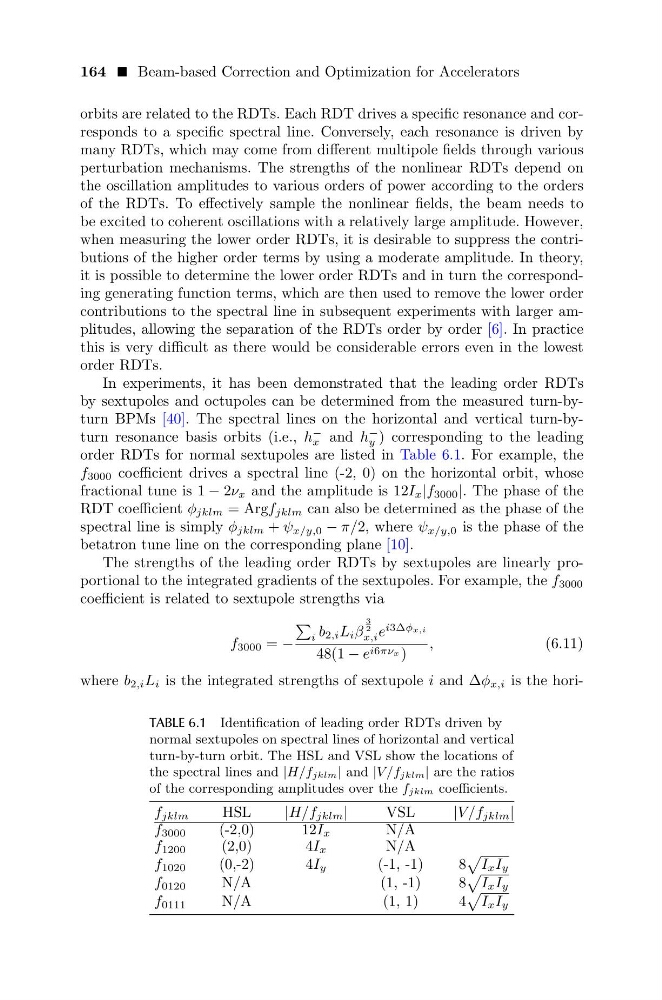
order RDTs for normal sextupoles are listed in Table 6.1. For example, the
f 3000 coefficient drives a spectral line (-2, 0) on the horizontal orbit, whose
fractional tune is 1 − 2ν x and the amplitude is 12I x |f 3000 |. The phase of the
RDT coefficient φ jklm = Argf jklm can also be determined as the phase of the
spectral line is simply φ jklm + ψ x/y,0 − π/2, where ψ x/y,0 is the phase of the
betatron tune line on the corresponding plane [10].
The strengths of the leading order RDTs by sextupoles are linearly proportional to the integrated gradients of the sextupoles. For example, the f 3000
coefficient is related to sextupole strengths via
f 3000 = −
i b 2,i L i β
3
2
x,i e
i3∆φx,i
48(1 − e i6πνx )
,
(6.11)
where b 2,i L i is the integrated strengths of sextupole i and ∆φ x,i is the horiTABLE 6.1 Identification of leading order RDTs driven by
normal sextupoles on spectral lines of horizontal and vertical
turn-by-turn orbit. The HSL and VSL show the locations of
the spectral lines and |H/f jklm | and |V /f jklm | are the ratios
of the corresponding amplitudes over the f jklm coefficients.
f jklm
HSL
|H/f jklm |
VSL
|V /f jklm |
f 3000
(-2,0)
12I x
N/A
f 1200
(2,0)
4I x
N/A
f 1020
(0,-2)
4I y
(-1, -1)
8
I x I y
f 0120
N/A
(1, -1)
8
I x I y
f 0111
N/A
(1, 1)
4
I x I y
orbits are related to the RDTs. Each RDT drives a specific resonance and corresponds to a specific spectral line. Conversely, each resonance is driven by
many RDTs, which may come from different multipole fields through various
perturbation mechanisms. The strengths of the nonlinear RDTs depend on
the oscillation amplitudes to various orders of power according to the orders
of the RDTs. To effectively sample the nonlinear fields, the beam needs to
be excited to coherent oscillations with a relatively large amplitude. However,
when measuring the lower order RDTs, it is desirable to suppress the contributions of the higher order terms by using a moderate amplitude. In theory,
it is possible to determine the lower order RDTs and in turn the corresponding generating function terms, which are then used to remove the lower order
contributions to the spectral line in subsequent experiments with larger amplitudes, allowing the separation of the RDTs order by order [6]. In practice
this is very difficult as there would be considerable errors even in the lowest
order RDTs.
In experiments, it has been demonstrated that the leading order RDTs
by sextupoles and octupoles can be determined from the measured turn-byturn BPMs [40]. The spectral lines on the horizontal and vertical turn-byturn resonance basis orbits (i.e., h
−
x and h
−
y ) corresponding to the leading
order RDTs for normal sextupoles are listed in Table 6.1. For example, the
f 3000 coefficient drives a spectral line (-2, 0) on the horizontal orbit, whose
fractional tune is 1 − 2ν x and the amplitude is 12I x |f 3000 |. The phase of the
RDT coefficient φ jklm = Argf jklm can also be determined as the phase of the
spectral line is simply φ jklm + ψ x/y,0 − π/2, where ψ x/y,0 is the phase of the
betatron tune line on the corresponding plane [10].
The strengths of the leading order RDTs by sextupoles are linearly proportional to the integrated gradients of the sextupoles. For example, the f 3000
coefficient is related to sextupole strengths via
f 3000 = −
i b 2,i L i β
3
2
x,i e
i3∆φx,i
48(1 − e i6πνx )
,
(6.11)
where b 2,i L i is the integrated strengths of sextupole i and ∆φ x,i is the horiTABLE 6.1 Identification of leading order RDTs driven by
normal sextupoles on spectral lines of horizontal and vertical
turn-by-turn orbit. The HSL and VSL show the locations of
the spectral lines and |H/f jklm | and |V /f jklm | are the ratios
of the corresponding amplitudes over the f jklm coefficients.
f jklm
HSL
|H/f jklm |
VSL
|V /f jklm |
f 3000
(-2,0)
12I x
N/A
f 1200
(2,0)
4I x
N/A
f 1020
(0,-2)
4I y
(-1, -1)
8
I x I y
f 0120
N/A
(1, -1)
8
I x I y
f 0111
N/A
(1, 1)
4
I x I y