

Linear optics measurement and correction - II 141
0
1
2
3
-1
0
1
C
s
( )
mode 1
mode 3
0
0.1
0.2
0.3
tune
0
10
20
|F(s)|
s 1
s 3
0
500
1000
turn
-0.05
0
0.05
s
1
0
500
1000
turn
-0.2
0
0.2
s
3
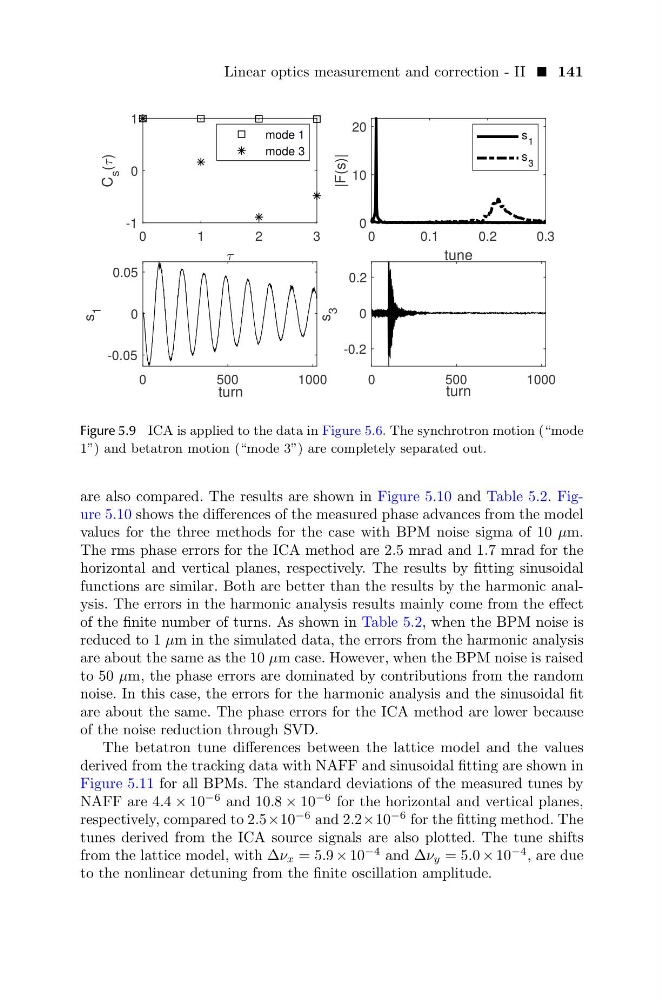
Figure 5.9 ICA is applied to the data in Figure 5.6. The synchrotron motion (“mode
1”) and betatron motion (“mode 3”) are completely separated out.
are also compared. The results are shown in Figure 5.10 and Table 5.2. Figure 5.10 shows the differences of the measured phase advances from the model
values for the three methods for the case with BPM noise sigma of 10 µm.
The rms phase errors for the ICA method are 2.5 mrad and 1.7 mrad for the
horizontal and vertical planes, respectively. The results by fitting sinusoidal
functions are similar. Both are better than the results by the harmonic analysis. The errors in the harmonic analysis results mainly come from the effect
of the finite number of turns. As shown in Table 5.2, when the BPM noise is
reduced to 1 µm in the simulated data, the errors from the harmonic analysis
are about the same as the 10 µm case. However, when the BPM noise is raised
to 50 µm, the phase errors are dominated by contributions from the random
noise. In this case, the errors for the harmonic analysis and the sinusoidal fit
are about the same. The phase errors for the ICA method are lower because
of the noise reduction through SVD.
The betatron tune differences between the lattice model and the values
derived from the tracking data with NAFF and sinusoidal fitting are shown in
Figure 5.11 for all BPMs. The standard deviations of the measured tunes by
NAFF are 4.4 × 10
−6 and 10.8 × 10
−6 for the horizontal and vertical planes,
respectively, compared to 2.5×10
−6 and 2.2×10
−6 for the fitting method. The
tunes derived from the ICA source signals are also plotted. The tune shifts
from the lattice model, with ∆ν x = 5.9 × 10
−4 and ∆ν y = 5.0 × 10
−4 , are due
to the nonlinear detuning from the finite oscillation amplitude.
0
1
2
3
-1
0
1
C
s
( )
mode 1
mode 3
0
0.1
0.2
0.3
tune
0
10
20
|F(s)|
s 1
s 3
0
500
1000
turn
-0.05
0
0.05
s
1
0
500
1000
turn
-0.2
0
0.2
s
3
Figure 5.9 ICA is applied to the data in Figure 5.6. The synchrotron motion (“mode
1”) and betatron motion (“mode 3”) are completely separated out.
are also compared. The results are shown in Figure 5.10 and Table 5.2. Figure 5.10 shows the differences of the measured phase advances from the model
values for the three methods for the case with BPM noise sigma of 10 µm.
The rms phase errors for the ICA method are 2.5 mrad and 1.7 mrad for the
horizontal and vertical planes, respectively. The results by fitting sinusoidal
functions are similar. Both are better than the results by the harmonic analysis. The errors in the harmonic analysis results mainly come from the effect
of the finite number of turns. As shown in Table 5.2, when the BPM noise is
reduced to 1 µm in the simulated data, the errors from the harmonic analysis
are about the same as the 10 µm case. However, when the BPM noise is raised
to 50 µm, the phase errors are dominated by contributions from the random
noise. In this case, the errors for the harmonic analysis and the sinusoidal fit
are about the same. The phase errors for the ICA method are lower because
of the noise reduction through SVD.
The betatron tune differences between the lattice model and the values
derived from the tracking data with NAFF and sinusoidal fitting are shown in
Figure 5.11 for all BPMs. The standard deviations of the measured tunes by
NAFF are 4.4 × 10
−6 and 10.8 × 10
−6 for the horizontal and vertical planes,
respectively, compared to 2.5×10
−6 and 2.2×10
−6 for the fitting method. The
tunes derived from the ICA source signals are also plotted. The tune shifts
from the lattice model, with ∆ν x = 5.9 × 10
−4 and ∆ν y = 5.0 × 10
−4 , are due
to the nonlinear detuning from the finite oscillation amplitude.