

140 Beam-based Correction and Optimization for Accelerators
0
1
2
3
-1
0
1
C
s
( )
mode 1
mode 2
0.05 0.1 0.15 0.2 0.25
tune
0
5
10
|F(s)|
s 1
s 2
0
20
40
60
80
100
120
BPM index
-0.2
0
0.2
A
1
, A
2
H-BPM V-BPM
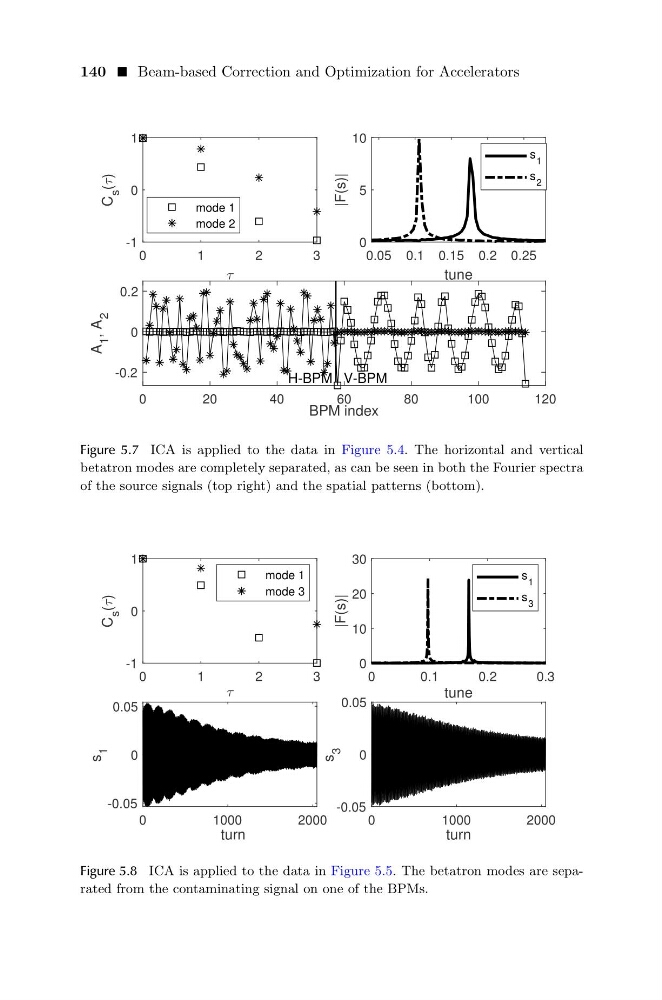
Figure 5.7 ICA is applied to the data in Figure 5.4. The horizontal and vertical
betatron modes are completely separated, as can be seen in both the Fourier spectra
of the source signals (top right) and the spatial patterns (bottom).
0
1
2
3
-1
0
1
C
s
( )
mode 1
mode 3
0
0.1
0.2
0.3
tune
0
10
20
30
|F(s)|
s 1
s 3
0
1000
2000
turn
-0.05
0
0.05
s
1
0
1000
2000
turn
-0.05
0
0.05
s
3
Figure 5.8 ICA is applied to the data in Figure 5.5. The betatron modes are separated from the contaminating signal on one of the BPMs.
0
1
2
3
-1
0
1
C
s
( )
mode 1
mode 2
0.05 0.1 0.15 0.2 0.25
tune
0
5
10
|F(s)|
s 1
s 2
0
20
40
60
80
100
120
BPM index
-0.2
0
0.2
A
1
, A
2
H-BPM V-BPM
Figure 5.7 ICA is applied to the data in Figure 5.4. The horizontal and vertical
betatron modes are completely separated, as can be seen in both the Fourier spectra
of the source signals (top right) and the spatial patterns (bottom).
0
1
2
3
-1
0
1
C
s
( )
mode 1
mode 3
0
0.1
0.2
0.3
tune
0
10
20
30
|F(s)|
s 1
s 3
0
1000
2000
turn
-0.05
0
0.05
s
1
0
1000
2000
turn
-0.05
0
0.05
s
3
Figure 5.8 ICA is applied to the data in Figure 5.5. The betatron modes are separated from the contaminating signal on one of the BPMs.