

136 Beam-based Correction and Optimization for Accelerators
0
1000
2000
turn
-1
0
1
x (mm)
0
5
10
15
SV index
10
0
10
2
SV
0
1000
2000
turn
-0.1
-0.05
0
0.05
v
1
0
0.2
0.4
tune
0
10
20
|F(v)|
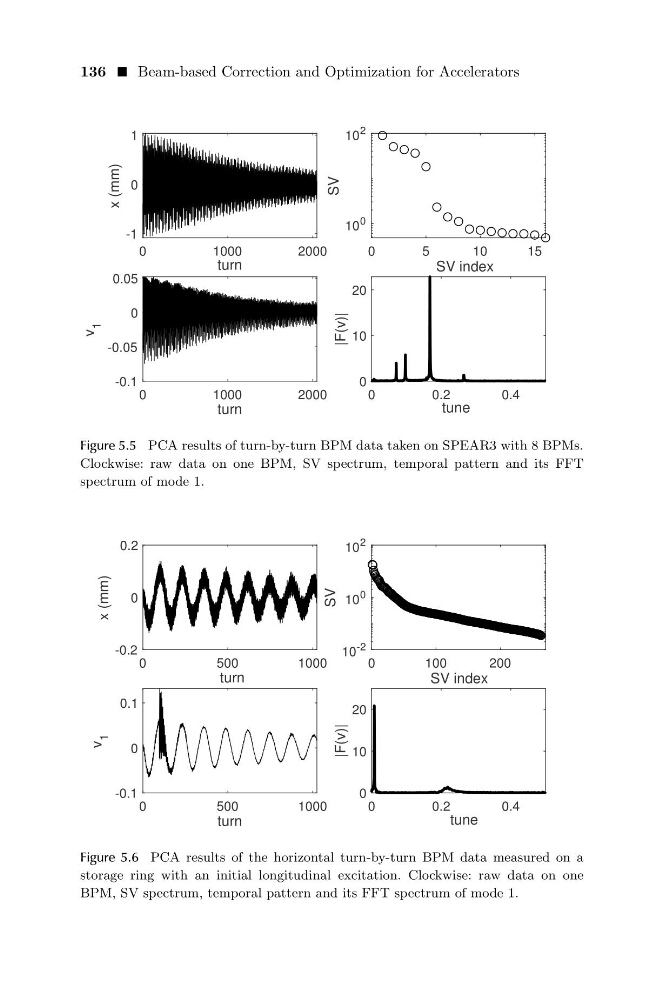
Figure 5.5 PCA results of turn-by-turn BPM data taken on SPEAR3 with 8 BPMs.
Clockwise: raw data on one BPM, SV spectrum, temporal pattern and its FFT
spectrum of mode 1.
0
500
1000
turn
-0.2
0
0.2
x (mm)
0
100
200
SV index
10
-2
10
0
10
2
SV
0
500
1000
turn
-0.1
0
0.1
v
1
0
0.2
0.4
tune
0
10
20
|F(v)|
Figure 5.6 PCA results of the horizontal turn-by-turn BPM data measured on a
storage ring with an initial longitudinal excitation. Clockwise: raw data on one
BPM, SV spectrum, temporal pattern and its FFT spectrum of mode 1.
0
1000
2000
turn
-1
0
1
x (mm)
0
5
10
15
SV index
10
0
10
2
SV
0
1000
2000
turn
-0.1
-0.05
0
0.05
v
1
0
0.2
0.4
tune
0
10
20
|F(v)|
Figure 5.5 PCA results of turn-by-turn BPM data taken on SPEAR3 with 8 BPMs.
Clockwise: raw data on one BPM, SV spectrum, temporal pattern and its FFT
spectrum of mode 1.
0
500
1000
turn
-0.2
0
0.2
x (mm)
0
100
200
SV index
10
-2
10
0
10
2
SV
0
500
1000
turn
-0.1
0
0.1
v
1
0
0.2
0.4
tune
0
10
20
|F(v)|
Figure 5.6 PCA results of the horizontal turn-by-turn BPM data measured on a
storage ring with an initial longitudinal excitation. Clockwise: raw data on one
BPM, SV spectrum, temporal pattern and its FFT spectrum of mode 1.