

Linear optics measurement and correction - II 127
0
0.1
0.2
0.3
0.4
0.5
tune,
10
-6
10
-4
10
-2
10
0
10
2
|F( )|
x
y
x
- y
2 x
2 y
x
+ y 3 x
4 x
2 x - y
original
residual
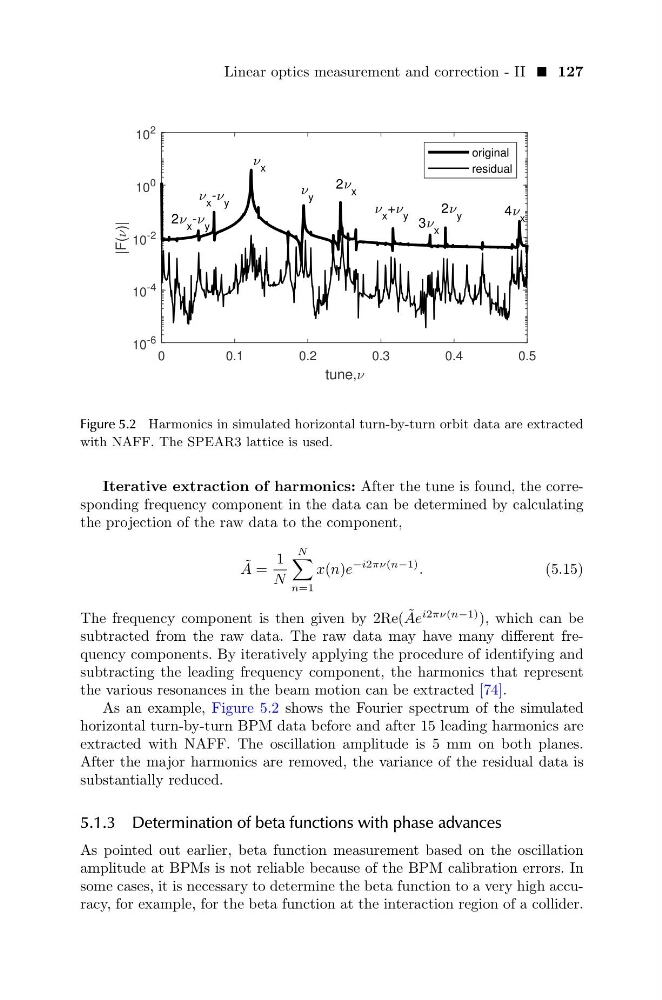
Figure 5.2 Harmonics in simulated horizontal turn-by-turn orbit data are extracted
with NAFF. The SPEAR3 lattice is used.
Iterative extraction of harmonics: After the tune is found, the corresponding frequency component in the data can be determined by calculating
the projection of the raw data to the component,
˜
A =
1
N
N
n=1
x(n)e
−i2πν(n−1) .
(5.15)
The frequency component is then given by 2Re( ˜
Ae
i2πν(n−1) ), which can be
subtracted from the raw data. The raw data may have many different frequency components. By iteratively applying the procedure of identifying and
subtracting the leading frequency component, the harmonics that represent
the various resonances in the beam motion can be extracted [74].
As an example, Figure 5.2 shows the Fourier spectrum of the simulated
horizontal turn-by-turn BPM data before and after 15 leading harmonics are
extracted with NAFF. The oscillation amplitude is 5 mm on both planes.
After the major harmonics are removed, the variance of the residual data is
substantially reduced.
5.1.3 Determination of beta functions with phase advances
As pointed out earlier, beta function measurement based on the oscillation
amplitude at BPMs is not reliable because of the BPM calibration errors. In
some cases, it is necessary to determine the beta function to a very high accuracy, for example, for the beta function at the interaction region of a collider.
0
0.1
0.2
0.3
0.4
0.5
tune,
10
-6
10
-4
10
-2
10
0
10
2
|F( )|
x
y
x
- y
2 x
2 y
x
+ y 3 x
4 x
2 x - y
original
residual
Figure 5.2 Harmonics in simulated horizontal turn-by-turn orbit data are extracted
with NAFF. The SPEAR3 lattice is used.
Iterative extraction of harmonics: After the tune is found, the corresponding frequency component in the data can be determined by calculating
the projection of the raw data to the component,
˜
A =
1
N
N
n=1
x(n)e
−i2πν(n−1) .
(5.15)
The frequency component is then given by 2Re( ˜
Ae
i2πν(n−1) ), which can be
subtracted from the raw data. The raw data may have many different frequency components. By iteratively applying the procedure of identifying and
subtracting the leading frequency component, the harmonics that represent
the various resonances in the beam motion can be extracted [74].
As an example, Figure 5.2 shows the Fourier spectrum of the simulated
horizontal turn-by-turn BPM data before and after 15 leading harmonics are
extracted with NAFF. The oscillation amplitude is 5 mm on both planes.
After the major harmonics are removed, the variance of the residual data is
substantially reduced.
5.1.3 Determination of beta functions with phase advances
As pointed out earlier, beta function measurement based on the oscillation
amplitude at BPMs is not reliable because of the BPM calibration errors. In
some cases, it is necessary to determine the beta function to a very high accuracy, for example, for the beta function at the interaction region of a collider.