

Top Curr Chem (Z) (2018) 376:24
1 3
(namely π-) stacking conformation (i.e. with d < 6 Å and α < 30°). The 2DUV–UV
spectra computed for selected snapshots along the rMD simulation indicate a good
correlation between the inter-chromophore distance and the quartic electronic coupling, with smaller d accompanied by larger shifts Δ (see Fig. 12b), which is less
sensitive to the relative orientation of the chromophores, with T-stacked or twisted
offset conformations possessing large quartic couplings. Significant correlations
are also observed in the 2DUV–Vis spectra [54], where the energetic positions
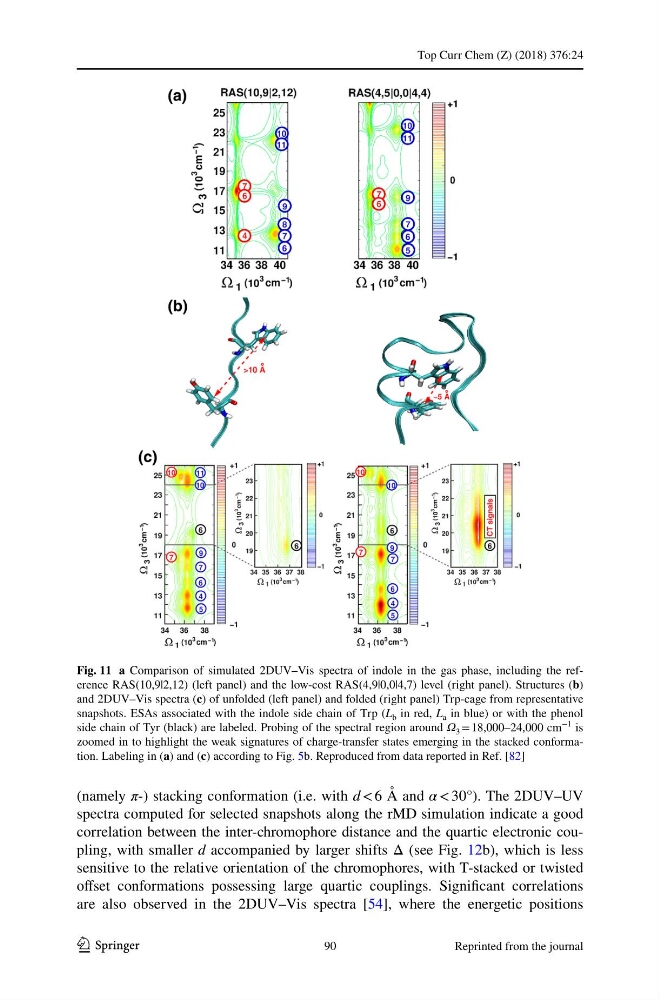
Fig. 11 a Comparison of simulated 2DUV–Vis spectra of indole in the gas phase, including the reference RAS(10,9|2,12) (left panel) and the low-cost RAS(4,9|0,0|4,7) level (right panel). Structures (b)
and 2DUV–Vis spectra (c) of unfolded (left panel) and folded (right panel) Trp-cage from representative
snapshots. ESAs associated with the indole side chain of Trp (L b in red, L a in blue) or with the phenol
side chain of Tyr (black) are labeled. Probing of the spectral region around Ω 3 = 18,000–24,000 cm
−1 is
zoomed in to highlight the weak signatures of charge-transfer states emerging in the stacked conformation. Labeling in (a) and (c) according to Fig. 5b. Reproduced from data reported in Ref. [82]
90
Reprinted from the journal
1 3
(namely π-) stacking conformation (i.e. with d < 6 Å and α < 30°). The 2DUV–UV
spectra computed for selected snapshots along the rMD simulation indicate a good
correlation between the inter-chromophore distance and the quartic electronic coupling, with smaller d accompanied by larger shifts Δ (see Fig. 12b), which is less
sensitive to the relative orientation of the chromophores, with T-stacked or twisted
offset conformations possessing large quartic couplings. Significant correlations
are also observed in the 2DUV–Vis spectra [54], where the energetic positions
Fig. 11 a Comparison of simulated 2DUV–Vis spectra of indole in the gas phase, including the reference RAS(10,9|2,12) (left panel) and the low-cost RAS(4,9|0,0|4,7) level (right panel). Structures (b)
and 2DUV–Vis spectra (c) of unfolded (left panel) and folded (right panel) Trp-cage from representative
snapshots. ESAs associated with the indole side chain of Trp (L b in red, L a in blue) or with the phenol
side chain of Tyr (black) are labeled. Probing of the spectral region around Ω 3 = 18,000–24,000 cm
−1 is
zoomed in to highlight the weak signatures of charge-transfer states emerging in the stacked conformation. Labeling in (a) and (c) according to Fig. 5b. Reproduced from data reported in Ref. [82]
90
Reprinted from the journal