

1 3
Top Curr Chem (Z) (2018) 376:24
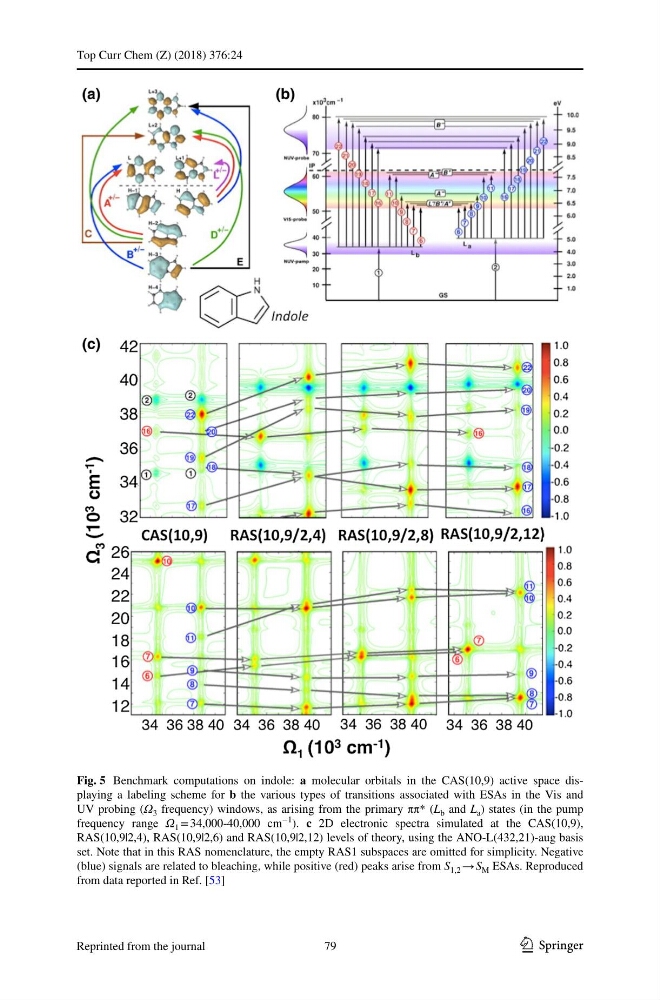
Fig. 5 Benchmark computations on indole: a molecular orbitals in the CAS(10,9) active space displaying a labeling scheme for b the various types of transitions associated with ESAs in the Vis and
UV probing (Ω 3 frequency) windows, as arising from the primary ππ* (L b and L a ) states (in the pump
frequency range Ω 1 = 34,000-40,000 cm
−1 ). c 2D electronic spectra simulated at the CAS(10,9),
RAS(10,9|2,4), RAS(10,9|2,6) and RAS(10,9|2,12) levels of theory, using the ANO-L(432,21)-aug basis
set. Note that in this RAS nomenclature, the empty RAS1 subspaces are omitted for simplicity. Negative
(blue) signals are related to bleaching, while positive (red) peaks arise from S 1,2 → S M ESAs. Reproduced
from data reported in Ref. [53]
79
Reprinted from the journal
Top Curr Chem (Z) (2018) 376:24
Fig. 5 Benchmark computations on indole: a molecular orbitals in the CAS(10,9) active space displaying a labeling scheme for b the various types of transitions associated with ESAs in the Vis and
UV probing (Ω 3 frequency) windows, as arising from the primary ππ* (L b and L a ) states (in the pump
frequency range Ω 1 = 34,000-40,000 cm
−1 ). c 2D electronic spectra simulated at the CAS(10,9),
RAS(10,9|2,4), RAS(10,9|2,6) and RAS(10,9|2,12) levels of theory, using the ANO-L(432,21)-aug basis
set. Note that in this RAS nomenclature, the empty RAS1 subspaces are omitted for simplicity. Negative
(blue) signals are related to bleaching, while positive (red) peaks arise from S 1,2 → S M ESAs. Reproduced
from data reported in Ref. [53]
79
Reprinted from the journal