

1 3
Top Curr Chem (Z) (2018) 376:10
state selectivity but the temporal resolution is lost. 2DES is capable of disentangling the excitonic states and to distinguish between electron and hole relaxation
dynamics.
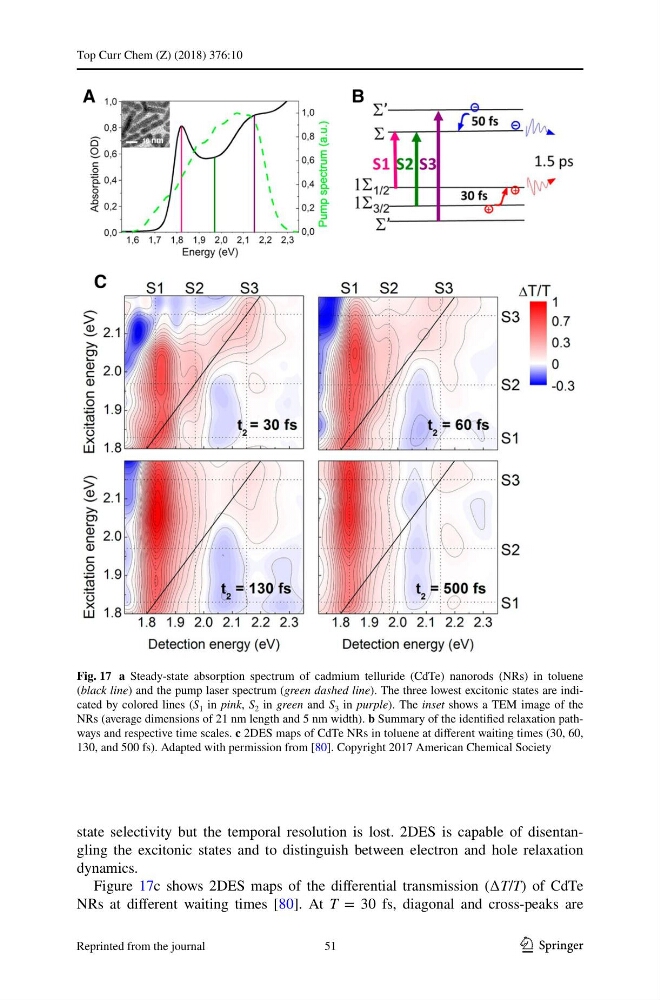
Figure 17c shows 2DES maps of the differential transmission (∆T/T) of CdTe
NRs at different waiting times [80]. At T = 30 fs, diagonal and cross-peaks are
Fig. 17 a Steady-state absorption spectrum of cadmium telluride (CdTe) nanorods (NRs) in toluene
(black line) and the pump laser spectrum (green dashed line). The three lowest excitonic states are indicated by colored lines (S 1 in pink, S 2 in green and S 3 in purple). The inset shows a TEM image of the
NRs (average dimensions of 21 nm length and 5 nm width). b Summary of the identified relaxation pathways and respective time scales. c 2DES maps of CdTe NRs in toluene at different waiting times (30, 60,
130, and 500 fs). Adapted with permission from [80]. Copyright 2017 American Chemical Society
51
Reprinted from the journal
Top Curr Chem (Z) (2018) 376:10
state selectivity but the temporal resolution is lost. 2DES is capable of disentangling the excitonic states and to distinguish between electron and hole relaxation
dynamics.
Figure 17c shows 2DES maps of the differential transmission (∆T/T) of CdTe
NRs at different waiting times [80]. At T = 30 fs, diagonal and cross-peaks are
Fig. 17 a Steady-state absorption spectrum of cadmium telluride (CdTe) nanorods (NRs) in toluene
(black line) and the pump laser spectrum (green dashed line). The three lowest excitonic states are indicated by colored lines (S 1 in pink, S 2 in green and S 3 in purple). The inset shows a TEM image of the
NRs (average dimensions of 21 nm length and 5 nm width). b Summary of the identified relaxation pathways and respective time scales. c 2DES maps of CdTe NRs in toluene at different waiting times (30, 60,
130, and 500 fs). Adapted with permission from [80]. Copyright 2017 American Chemical Society
51
Reprinted from the journal