

1 3
Top Curr Chem (Z) (2018) 376:10
5 Vibronic Coupling
The study of electronic coupling in complex systems benefits enormously from
2DES, due to the observation of coherent oscillations detected on the cross-peaks
of the 2DES maps [5, 6, 65] generated via broadband pulses. These oscillations can
be observed as an amplitude modulation of the dynamics along the waiting time T
measured at specific point on the excitation/detection 2DES map. The analysis of
such oscillations requires the acquisition of various 2DES maps at different waiting
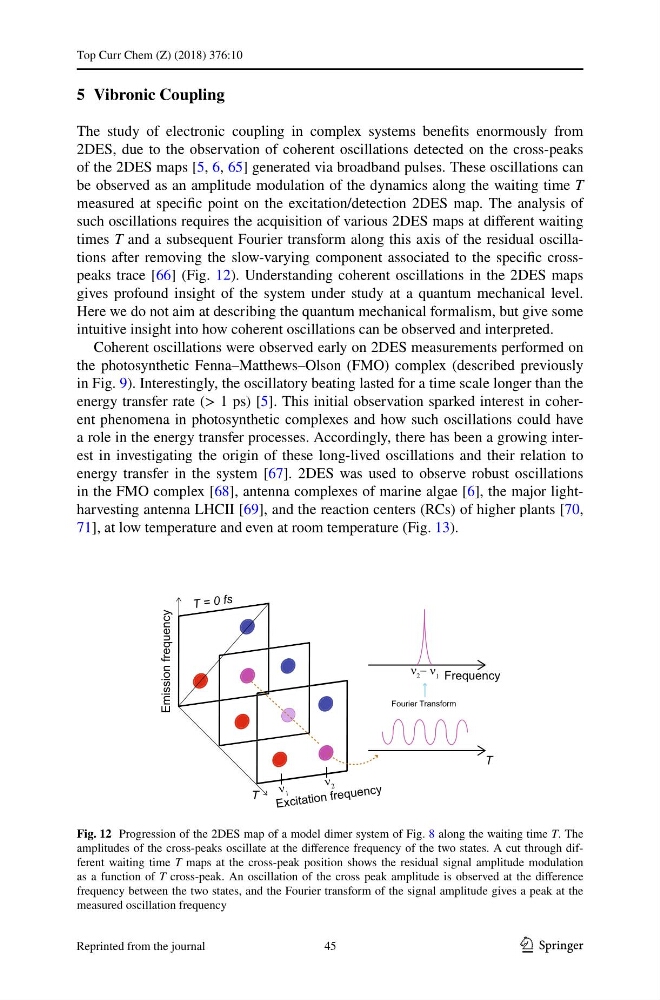
times T and a subsequent Fourier transform along this axis of the residual oscillations after removing the slow-varying component associated to the specific crosspeaks trace [66] (Fig. 12). Understanding coherent oscillations in the 2DES maps
gives profound insight of the system under study at a quantum mechanical level.
Here we do not aim at describing the quantum mechanical formalism, but give some
intuitive insight into how coherent oscillations can be observed and interpreted.
Coherent oscillations were observed early on 2DES measurements performed on
the photosynthetic Fenna–Matthews–Olson (FMO) complex (described previously
in Fig. 9). Interestingly, the oscillatory beating lasted for a time scale longer than the
energy transfer rate (> 1 ps) [5]. This initial observation sparked interest in coherent phenomena in photosynthetic complexes and how such oscillations could have
a role in the energy transfer processes. Accordingly, there has been a growing interest in investigating the origin of these long-lived oscillations and their relation to
energy transfer in the system [67]. 2DES was used to observe robust oscillations
in the FMO complex [68], antenna complexes of marine algae [6], the major lightharvesting antenna LHCII [69], and the reaction centers (RCs) of higher plants [70,
71], at low temperature and even at room temperature (Fig. 13).
T = 0 fs
Emission frequency
Ex cit ati on fre qu en cy
T
T
Fourier Transform
Frequency
Fig. 12 Progression of the 2DES map of a model dimer system of Fig. 8 along the waiting time T. The
amplitudes of the cross-peaks oscillate at the difference frequency of the two states. A cut through different waiting time T maps at the cross-peak position shows the residual signal amplitude modulation
as a function of T cross-peak. An oscillation of the cross peak amplitude is observed at the difference
frequency between the two states, and the Fourier transform of the signal amplitude gives a peak at the
measured oscillation frequency
45
Reprinted from the journal
Top Curr Chem (Z) (2018) 376:10
5 Vibronic Coupling
The study of electronic coupling in complex systems benefits enormously from
2DES, due to the observation of coherent oscillations detected on the cross-peaks
of the 2DES maps [5, 6, 65] generated via broadband pulses. These oscillations can
be observed as an amplitude modulation of the dynamics along the waiting time T
measured at specific point on the excitation/detection 2DES map. The analysis of
such oscillations requires the acquisition of various 2DES maps at different waiting
times T and a subsequent Fourier transform along this axis of the residual oscillations after removing the slow-varying component associated to the specific crosspeaks trace [66] (Fig. 12). Understanding coherent oscillations in the 2DES maps
gives profound insight of the system under study at a quantum mechanical level.
Here we do not aim at describing the quantum mechanical formalism, but give some
intuitive insight into how coherent oscillations can be observed and interpreted.
Coherent oscillations were observed early on 2DES measurements performed on
the photosynthetic Fenna–Matthews–Olson (FMO) complex (described previously
in Fig. 9). Interestingly, the oscillatory beating lasted for a time scale longer than the
energy transfer rate (> 1 ps) [5]. This initial observation sparked interest in coherent phenomena in photosynthetic complexes and how such oscillations could have
a role in the energy transfer processes. Accordingly, there has been a growing interest in investigating the origin of these long-lived oscillations and their relation to
energy transfer in the system [67]. 2DES was used to observe robust oscillations
in the FMO complex [68], antenna complexes of marine algae [6], the major lightharvesting antenna LHCII [69], and the reaction centers (RCs) of higher plants [70,
71], at low temperature and even at room temperature (Fig. 13).
T = 0 fs
Emission frequency
Ex cit ati on fre qu en cy
T
T
Fourier Transform
Frequency
Fig. 12 Progression of the 2DES map of a model dimer system of Fig. 8 along the waiting time T. The
amplitudes of the cross-peaks oscillate at the difference frequency of the two states. A cut through different waiting time T maps at the cross-peak position shows the residual signal amplitude modulation
as a function of T cross-peak. An oscillation of the cross peak amplitude is observed at the difference
frequency between the two states, and the Fourier transform of the signal amplitude gives a peak at the
measured oscillation frequency
45
Reprinted from the journal