

Top Curr Chem (Z) (2018) 376:10
1 3
observations were only possible thanks to the accurate analysis of cross-peaks and it
provided a basis for understanding the photo-physics of energy flow in CNT-based
devices.
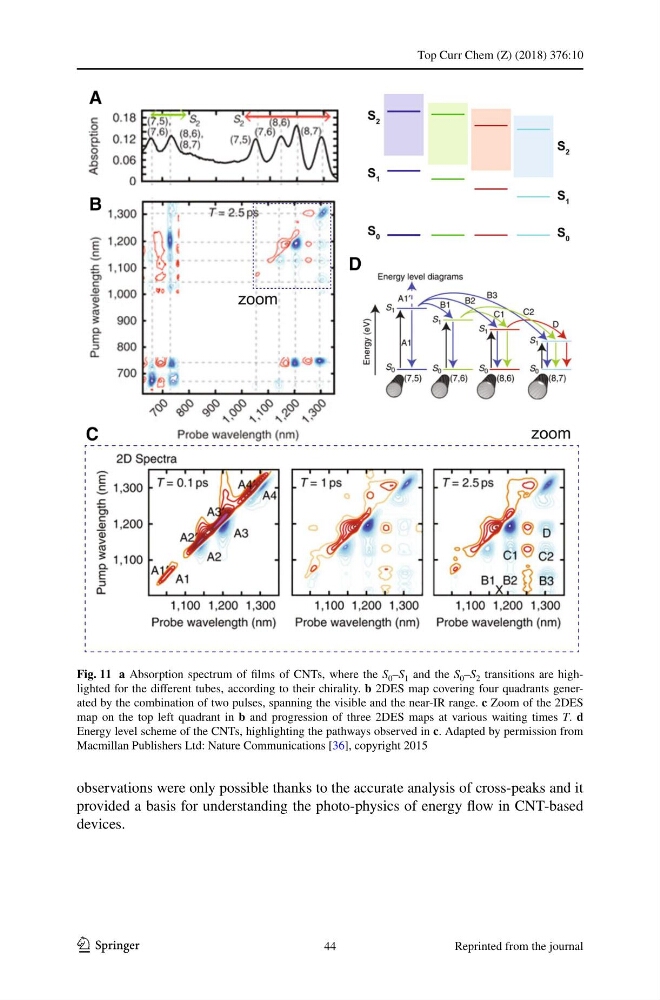
Fig. 11 a Absorption spectrum of films of CNTs, where the S 0 –S 1 and the S 0 –S 2 transitions are highlighted for the different tubes, according to their chirality. b 2DES map covering four quadrants generated by the combination of two pulses, spanning the visible and the near-IR range. c Zoom of the 2DES
map on the top left quadrant in b and progression of three 2DES maps at various waiting times T. d
Energy level scheme of the CNTs, highlighting the pathways observed in c. Adapted by permission from
Macmillan Publishers Ltd: Nature Communications [36], copyright 2015
44
Reprinted from the journal
1 3
observations were only possible thanks to the accurate analysis of cross-peaks and it
provided a basis for understanding the photo-physics of energy flow in CNT-based
devices.
Fig. 11 a Absorption spectrum of films of CNTs, where the S 0 –S 1 and the S 0 –S 2 transitions are highlighted for the different tubes, according to their chirality. b 2DES map covering four quadrants generated by the combination of two pulses, spanning the visible and the near-IR range. c Zoom of the 2DES
map on the top left quadrant in b and progression of three 2DES maps at various waiting times T. d
Energy level scheme of the CNTs, highlighting the pathways observed in c. Adapted by permission from
Macmillan Publishers Ltd: Nature Communications [36], copyright 2015
44
Reprinted from the journal