

Top Curr Chem (Z) (2018) 376:6
1 3
examples of 2D THz-Raman vibrational spectroscopies are discussed in the following sections.
4.2 2D THz‑THz‑Raman Spectroscopy of Intramolecular Vibrations
in Liquids
A demonstration of 2D THz-THz-Raman spectroscopy has successfully revealed the
anharmonic couplings between intramolecular vibrational modes in halogenated liquids [37]. The experimental setup used is the same as in Fig. 8. Two THz pulses with
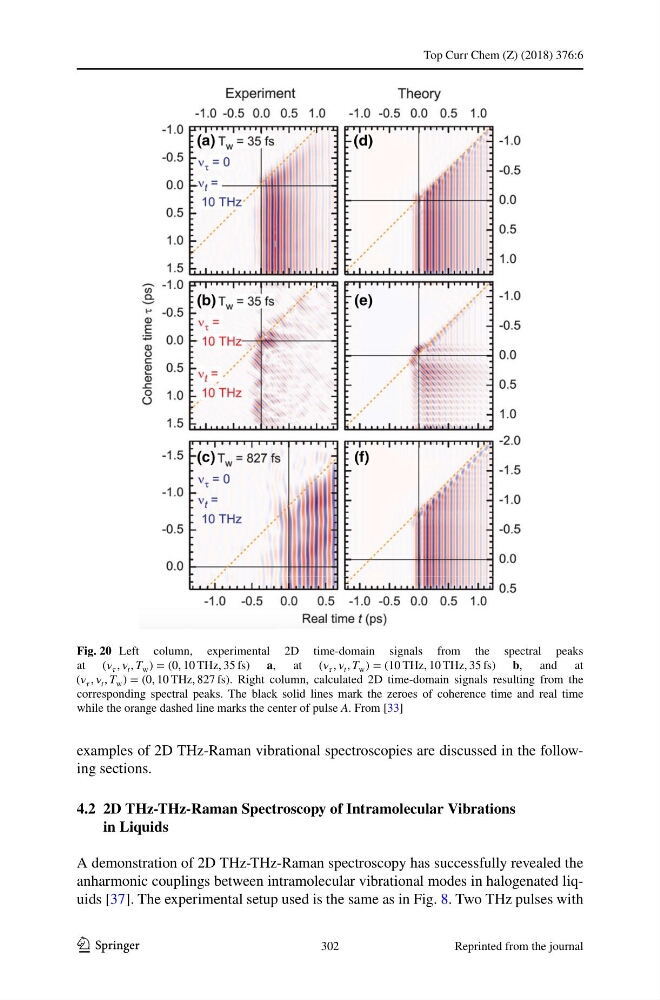
Fig. 20 Left column, experimental 2D time-domain signals from the spectral peaks
at ( , t , T w ) = (0, 10 THz, 35 fs) a, at ( , t , T w ) = (10 THz, 10 THz, 35 fs) b, and at
( , t , T w ) = (0, 10 THz, 827 fs) . Right column, calculated 2D time-domain signals resulting from the
corresponding spectral peaks. The black solid lines mark the zeroes of coherence time and real time
while the orange dashed line marks the center of pulse A. From [33]
302
Reprinted from the journal
1 3
examples of 2D THz-Raman vibrational spectroscopies are discussed in the following sections.
4.2 2D THz‑THz‑Raman Spectroscopy of Intramolecular Vibrations
in Liquids
A demonstration of 2D THz-THz-Raman spectroscopy has successfully revealed the
anharmonic couplings between intramolecular vibrational modes in halogenated liquids [37]. The experimental setup used is the same as in Fig. 8. Two THz pulses with
Fig. 20 Left column, experimental 2D time-domain signals from the spectral peaks
at ( , t , T w ) = (0, 10 THz, 35 fs) a, at ( , t , T w ) = (10 THz, 10 THz, 35 fs) b, and at
( , t , T w ) = (0, 10 THz, 827 fs) . Right column, calculated 2D time-domain signals resulting from the
corresponding spectral peaks. The black solid lines mark the zeroes of coherence time and real time
while the orange dashed line marks the center of pulse A. From [33]
302
Reprinted from the journal