

Top Curr Chem (Z) (2018) 376:6
1 3
To study the nonlinear responses of the two-phonon coherences in detail, 2D
THz spectroscopy with three pulses was conducted. The pulse sequence is shown
in Fig. 18. The coherence time and waiting (population) time are denoted by τ and
T w , respectively, while the “real” time is the EOS detection time with its zero at
the peak of pulse C. The 2D time-domain signals emerging from the sample in
response to the three THz pulses and the 2D THz spectra at two different waiting
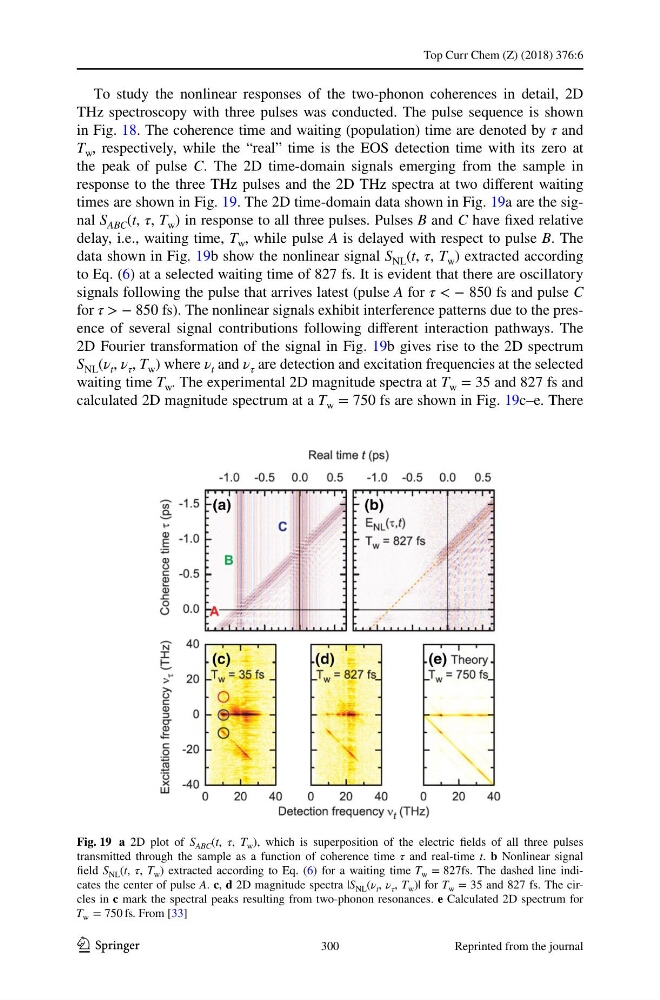
times are shown in Fig. 19. The 2D time-domain data shown in Fig. 19a are the signal S ABC (t, τ, T w ) in response to all three pulses. Pulses B and C have fixed relative
delay, i.e., waiting time, T w , while pulse A is delayed with respect to pulse B. The
data shown in Fig. 19b show the nonlinear signal S NL (t, τ, T w ) extracted according
to Eq. (6) at a selected waiting time of 827 fs. It is evident that there are oscillatory
signals following the pulse that arrives latest (pulse A for τ < − 850 fs and pulse C
for τ > − 850 fs). The nonlinear signals exhibit interference patterns due to the presence of several signal contributions following different interaction pathways. The
2D Fourier transformation of the signal in Fig. 19b gives rise to the 2D spectrum
S NL (ν t , ν τ , T w ) where ν t and ν τ are detection and excitation frequencies at the selected
waiting time T w . The experimental 2D magnitude spectra at T w = 35 and 827 fs and
calculated 2D magnitude spectrum at a T w = 750 fs are shown in Fig. 19c–e. There
Fig. 19 a 2D plot of S ABC (t, τ, T w ), which is superposition of the electric fields of all three pulses
transmitted through the sample as a function of coherence time τ and real-time t. b Nonlinear signal
field S NL (t, τ, T w ) extracted according to Eq. (6) for a waiting time T w = 827fs . The dashed line indicates the center of pulse A. c, d 2D magnitude spectra |S NL (ν t , ν τ , T w )| for T w = 35 and 827 fs. The circles in c mark the spectral peaks resulting from two-phonon resonances. e Calculated 2D spectrum for
T w = 750 fs. From [33]
300
Reprinted from the journal
1 3
To study the nonlinear responses of the two-phonon coherences in detail, 2D
THz spectroscopy with three pulses was conducted. The pulse sequence is shown
in Fig. 18. The coherence time and waiting (population) time are denoted by τ and
T w , respectively, while the “real” time is the EOS detection time with its zero at
the peak of pulse C. The 2D time-domain signals emerging from the sample in
response to the three THz pulses and the 2D THz spectra at two different waiting
times are shown in Fig. 19. The 2D time-domain data shown in Fig. 19a are the signal S ABC (t, τ, T w ) in response to all three pulses. Pulses B and C have fixed relative
delay, i.e., waiting time, T w , while pulse A is delayed with respect to pulse B. The
data shown in Fig. 19b show the nonlinear signal S NL (t, τ, T w ) extracted according
to Eq. (6) at a selected waiting time of 827 fs. It is evident that there are oscillatory
signals following the pulse that arrives latest (pulse A for τ < − 850 fs and pulse C
for τ > − 850 fs). The nonlinear signals exhibit interference patterns due to the presence of several signal contributions following different interaction pathways. The
2D Fourier transformation of the signal in Fig. 19b gives rise to the 2D spectrum
S NL (ν t , ν τ , T w ) where ν t and ν τ are detection and excitation frequencies at the selected
waiting time T w . The experimental 2D magnitude spectra at T w = 35 and 827 fs and
calculated 2D magnitude spectrum at a T w = 750 fs are shown in Fig. 19c–e. There
Fig. 19 a 2D plot of S ABC (t, τ, T w ), which is superposition of the electric fields of all three pulses
transmitted through the sample as a function of coherence time τ and real-time t. b Nonlinear signal
field S NL (t, τ, T w ) extracted according to Eq. (6) for a waiting time T w = 827fs . The dashed line indicates the center of pulse A. c, d 2D magnitude spectra |S NL (ν t , ν τ , T w )| for T w = 35 and 827 fs. The circles in c mark the spectral peaks resulting from two-phonon resonances. e Calculated 2D spectrum for
T w = 750 fs. From [33]
300
Reprinted from the journal