

1 3
Top Curr Chem (Z) (2018) 376:6
4.1 2D THz Spectroscopy of Phonons in Semiconductors
The first demonstration of 2D THz spectroscopy with three THz pulses has been
realized very recently in the study of phonon nonlinearity in the semiconductor indium antimonide (InSb) crystal [33, 34]. The experimental setup is shown in
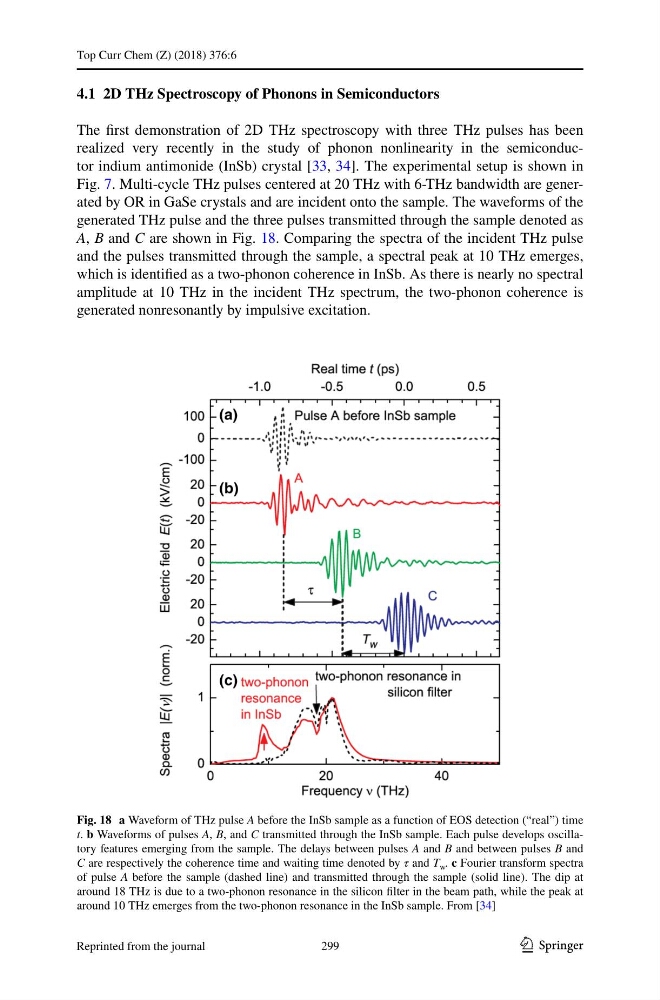
Fig. 7. Multi-cycle THz pulses centered at 20 THz with 6-THz bandwidth are generated by OR in GaSe crystals and are incident onto the sample. The waveforms of the
generated THz pulse and the three pulses transmitted through the sample denoted as
A, B and C are shown in Fig. 18. Comparing the spectra of the incident THz pulse
and the pulses transmitted through the sample, a spectral peak at 10 THz emerges,
which is identified as a two-phonon coherence in InSb. As there is nearly no spectral
amplitude at 10 THz in the incident THz spectrum, the two-phonon coherence is
generated nonresonantly by impulsive excitation.
Fig. 18 a Waveform of THz pulse A before the InSb sample as a function of EOS detection (“real”) time
t. b Waveforms of pulses A, B, and C transmitted through the InSb sample. Each pulse develops oscillatory features emerging from the sample. The delays between pulses A and B and between pulses B and
C are respectively the coherence time and waiting time denoted by τ and T w . c Fourier transform spectra
of pulse A before the sample (dashed line) and transmitted through the sample (solid line). The dip at
around 18 THz is due to a two-phonon resonance in the silicon filter in the beam path, while the peak at
around 10 THz emerges from the two-phonon resonance in the InSb sample. From [34]
299
Reprinted from the journal
Top Curr Chem (Z) (2018) 376:6
4.1 2D THz Spectroscopy of Phonons in Semiconductors
The first demonstration of 2D THz spectroscopy with three THz pulses has been
realized very recently in the study of phonon nonlinearity in the semiconductor indium antimonide (InSb) crystal [33, 34]. The experimental setup is shown in
Fig. 7. Multi-cycle THz pulses centered at 20 THz with 6-THz bandwidth are generated by OR in GaSe crystals and are incident onto the sample. The waveforms of the
generated THz pulse and the three pulses transmitted through the sample denoted as
A, B and C are shown in Fig. 18. Comparing the spectra of the incident THz pulse
and the pulses transmitted through the sample, a spectral peak at 10 THz emerges,
which is identified as a two-phonon coherence in InSb. As there is nearly no spectral
amplitude at 10 THz in the incident THz spectrum, the two-phonon coherence is
generated nonresonantly by impulsive excitation.
Fig. 18 a Waveform of THz pulse A before the InSb sample as a function of EOS detection (“real”) time
t. b Waveforms of pulses A, B, and C transmitted through the InSb sample. Each pulse develops oscillatory features emerging from the sample. The delays between pulses A and B and between pulses B and
C are respectively the coherence time and waiting time denoted by τ and T w . c Fourier transform spectra
of pulse A before the sample (dashed line) and transmitted through the sample (solid line). The dip at
around 18 THz is due to a two-phonon resonance in the silicon filter in the beam path, while the peak at
around 10 THz emerges from the two-phonon resonance in the InSb sample. From [34]
299
Reprinted from the journal