

1 3
Top Curr Chem (Z) (2018) 376:6
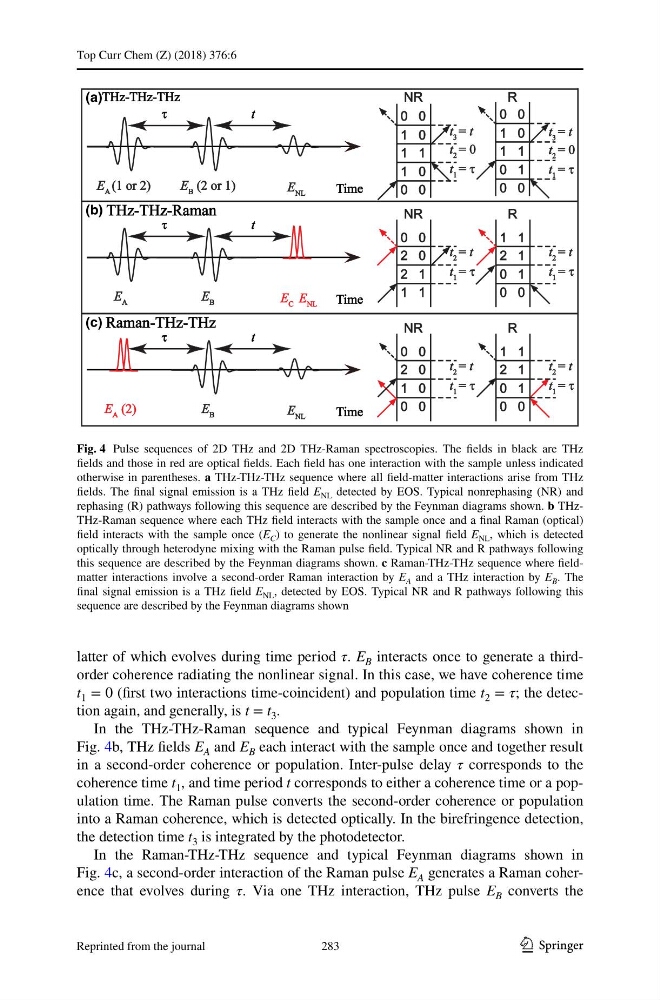
latter of which evolves during time period τ. E B interacts once to generate a thirdorder coherence radiating the nonlinear signal. In this case, we have coherence time
t 1 = 0 (first two interactions time-coincident) and population time t 2 = τ; the detection again, and generally, is t = t 3 .
In the THz-THz-Raman sequence and typical Feynman diagrams shown in
Fig. 4b, THz fields E A and E B each interact with the sample once and together result
in a second-order coherence or population. Inter-pulse delay τ corresponds to the
coherence time t 1 , and time period t corresponds to either a coherence time or a population time. The Raman pulse converts the second-order coherence or population
into a Raman coherence, which is detected optically. In the birefringence detection,
the detection time t 3 is integrated by the photodetector.
In the Raman-THz-THz sequence and typical Feynman diagrams shown in
Fig. 4c, a second-order interaction of the Raman pulse E A generates a Raman coherence that evolves during τ. Via one THz interaction, THz pulse E B converts the
(a)
(b)
(c)
Fig. 4 Pulse sequences of 2D THz and 2D THz-Raman spectroscopies. The fields in black are THz
fields and those in red are optical fields. Each field has one interaction with the sample unless indicated
otherwise in parentheses. a THz-THz-THz sequence where all field-matter interactions arise from THz
fields. The final signal emission is a THz field E NL detected by EOS. Typical nonrephasing (NR) and
rephasing (R) pathways following this sequence are described by the Feynman diagrams shown. b THzTHz-Raman sequence where each THz field interacts with the sample once and a final Raman (optical)
field interacts with the sample once (E C ) to generate the nonlinear signal field E NL , which is detected
optically through heterodyne mixing with the Raman pulse field. Typical NR and R pathways following
this sequence are described by the Feynman diagrams shown. c Raman-THz-THz sequence where fieldmatter interactions involve a second-order Raman interaction by E A and a THz interaction by E B . The
final signal emission is a THz field E NL , detected by EOS. Typical NR and R pathways following this
sequence are described by the Feynman diagrams shown
283
Reprinted from the journal
Top Curr Chem (Z) (2018) 376:6
latter of which evolves during time period τ. E B interacts once to generate a thirdorder coherence radiating the nonlinear signal. In this case, we have coherence time
t 1 = 0 (first two interactions time-coincident) and population time t 2 = τ; the detection again, and generally, is t = t 3 .
In the THz-THz-Raman sequence and typical Feynman diagrams shown in
Fig. 4b, THz fields E A and E B each interact with the sample once and together result
in a second-order coherence or population. Inter-pulse delay τ corresponds to the
coherence time t 1 , and time period t corresponds to either a coherence time or a population time. The Raman pulse converts the second-order coherence or population
into a Raman coherence, which is detected optically. In the birefringence detection,
the detection time t 3 is integrated by the photodetector.
In the Raman-THz-THz sequence and typical Feynman diagrams shown in
Fig. 4c, a second-order interaction of the Raman pulse E A generates a Raman coherence that evolves during τ. Via one THz interaction, THz pulse E B converts the
(a)
(b)
(c)
Fig. 4 Pulse sequences of 2D THz and 2D THz-Raman spectroscopies. The fields in black are THz
fields and those in red are optical fields. Each field has one interaction with the sample unless indicated
otherwise in parentheses. a THz-THz-THz sequence where all field-matter interactions arise from THz
fields. The final signal emission is a THz field E NL detected by EOS. Typical nonrephasing (NR) and
rephasing (R) pathways following this sequence are described by the Feynman diagrams shown. b THzTHz-Raman sequence where each THz field interacts with the sample once and a final Raman (optical)
field interacts with the sample once (E C ) to generate the nonlinear signal field E NL , which is detected
optically through heterodyne mixing with the Raman pulse field. Typical NR and R pathways following
this sequence are described by the Feynman diagrams shown. c Raman-THz-THz sequence where fieldmatter interactions involve a second-order Raman interaction by E A and a THz interaction by E B . The
final signal emission is a THz field E NL , detected by EOS. Typical NR and R pathways following this
sequence are described by the Feynman diagrams shown
283
Reprinted from the journal