

1 3
Top Curr Chem (Z) (2018) 376:6
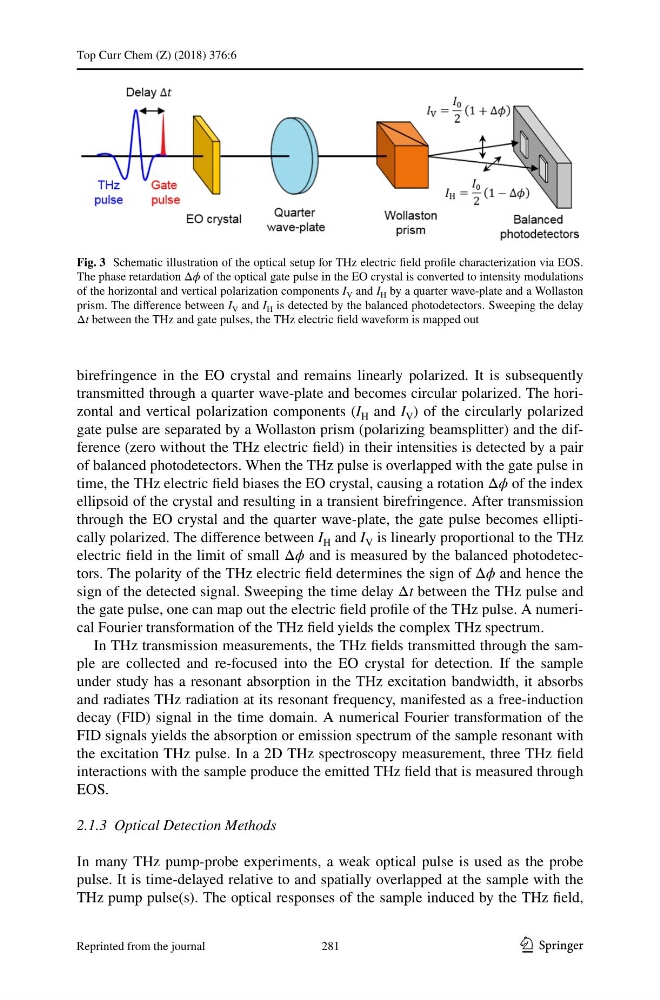
birefringence in the EO crystal and remains linearly polarized. It is subsequently
transmitted through a quarter wave-plate and becomes circular polarized. The horizontal and vertical polarization components (I H and I V ) of the circularly polarized
gate pulse are separated by a Wollaston prism (polarizing beamsplitter) and the difference (zero without the THz electric field) in their intensities is detected by a pair
of balanced photodetectors. When the THz pulse is overlapped with the gate pulse in
time, the THz electric field biases the EO crystal, causing a rotation Δϕ of the index
ellipsoid of the crystal and resulting in a transient birefringence. After transmission
through the EO crystal and the quarter wave-plate, the gate pulse becomes elliptically polarized. The difference between I H and I V is linearly proportional to the THz
electric field in the limit of small Δϕ and is measured by the balanced photodetectors. The polarity of the THz electric field determines the sign of Δϕ and hence the
sign of the detected signal. Sweeping the time delay Δt between the THz pulse and
the gate pulse, one can map out the electric field profile of the THz pulse. A numerical Fourier transformation of the THz field yields the complex THz spectrum.
In THz transmission measurements, the THz fields transmitted through the sample are collected and re-focused into the EO crystal for detection. If the sample
under study has a resonant absorption in the THz excitation bandwidth, it absorbs
and radiates THz radiation at its resonant frequency, manifested as a free-induction
decay (FID) signal in the time domain. A numerical Fourier transformation of the
FID signals yields the absorption or emission spectrum of the sample resonant with
the excitation THz pulse. In a 2D THz spectroscopy measurement, three THz field
interactions with the sample produce the emitted THz field that is measured through
EOS.
2.1.3 Optical Detection Methods
In many THz pump-probe experiments, a weak optical pulse is used as the probe
pulse. It is time-delayed relative to and spatially overlapped at the sample with the
THz pump pulse(s). The optical responses of the sample induced by the THz field,
Fig. 3 Schematic illustration of the optical setup for THz electric field profile characterization via EOS.
The phase retardation Δϕ of the optical gate pulse in the EO crystal is converted to intensity modulations
of the horizontal and vertical polarization components I V and I H by a quarter wave-plate and a Wollaston
prism. The difference between I V and I H is detected by the balanced photodetectors. Sweeping the delay
Δt between the THz and gate pulses, the THz electric field waveform is mapped out
281
Reprinted from the journal
Top Curr Chem (Z) (2018) 376:6
birefringence in the EO crystal and remains linearly polarized. It is subsequently
transmitted through a quarter wave-plate and becomes circular polarized. The horizontal and vertical polarization components (I H and I V ) of the circularly polarized
gate pulse are separated by a Wollaston prism (polarizing beamsplitter) and the difference (zero without the THz electric field) in their intensities is detected by a pair
of balanced photodetectors. When the THz pulse is overlapped with the gate pulse in
time, the THz electric field biases the EO crystal, causing a rotation Δϕ of the index
ellipsoid of the crystal and resulting in a transient birefringence. After transmission
through the EO crystal and the quarter wave-plate, the gate pulse becomes elliptically polarized. The difference between I H and I V is linearly proportional to the THz
electric field in the limit of small Δϕ and is measured by the balanced photodetectors. The polarity of the THz electric field determines the sign of Δϕ and hence the
sign of the detected signal. Sweeping the time delay Δt between the THz pulse and
the gate pulse, one can map out the electric field profile of the THz pulse. A numerical Fourier transformation of the THz field yields the complex THz spectrum.
In THz transmission measurements, the THz fields transmitted through the sample are collected and re-focused into the EO crystal for detection. If the sample
under study has a resonant absorption in the THz excitation bandwidth, it absorbs
and radiates THz radiation at its resonant frequency, manifested as a free-induction
decay (FID) signal in the time domain. A numerical Fourier transformation of the
FID signals yields the absorption or emission spectrum of the sample resonant with
the excitation THz pulse. In a 2D THz spectroscopy measurement, three THz field
interactions with the sample produce the emitted THz field that is measured through
EOS.
2.1.3 Optical Detection Methods
In many THz pump-probe experiments, a weak optical pulse is used as the probe
pulse. It is time-delayed relative to and spatially overlapped at the sample with the
THz pump pulse(s). The optical responses of the sample induced by the THz field,
Fig. 3 Schematic illustration of the optical setup for THz electric field profile characterization via EOS.
The phase retardation Δϕ of the optical gate pulse in the EO crystal is converted to intensity modulations
of the horizontal and vertical polarization components I V and I H by a quarter wave-plate and a Wollaston
prism. The difference between I V and I H is detected by the balanced photodetectors. Sweeping the delay
Δt between the THz and gate pulses, the THz electric field waveform is mapped out
281
Reprinted from the journal