

Topics in Current Chemistry (2018) 376:35
1 3
near-resonant, up to completely electronically resonant leads to different degrees of
vibrational coherence in the excited state. While electronically non-resonant excitation cannot induce any vibrational coherence in the excited state, near resonant excitation, for example, can induce low-frequency vibrational coherence only. Complete
resonant excitation is able to induce high- as well as low-frequency coherence in the
excited state. This dependence on the spectral overlap between an absorption spectrum and VCS laser spectrum is different for the groundstate, where low- as well as
high-frequency modes will be always induced. By comparing how the amplitude of
specific vibrational modes decreases when the excitation becomes non-resonant, it
is possible to pinpoint which vibrational modes are present only in the excited state
or in both states, and how specific vibrational modes are being activated (via direct
laser interaction or via coherent excitation from other vibrational mode) [10, 19, 28,
70]. For example, this has been applied to retinal protonated Schiff base (RPSB)
to show that low-frequency modes are not active in the electronic ground state but
are coherently activated by vibrational energy redistribution from high-frequency
modes directly excited in the electronic excited state [71]. In FSRS, the detuning of
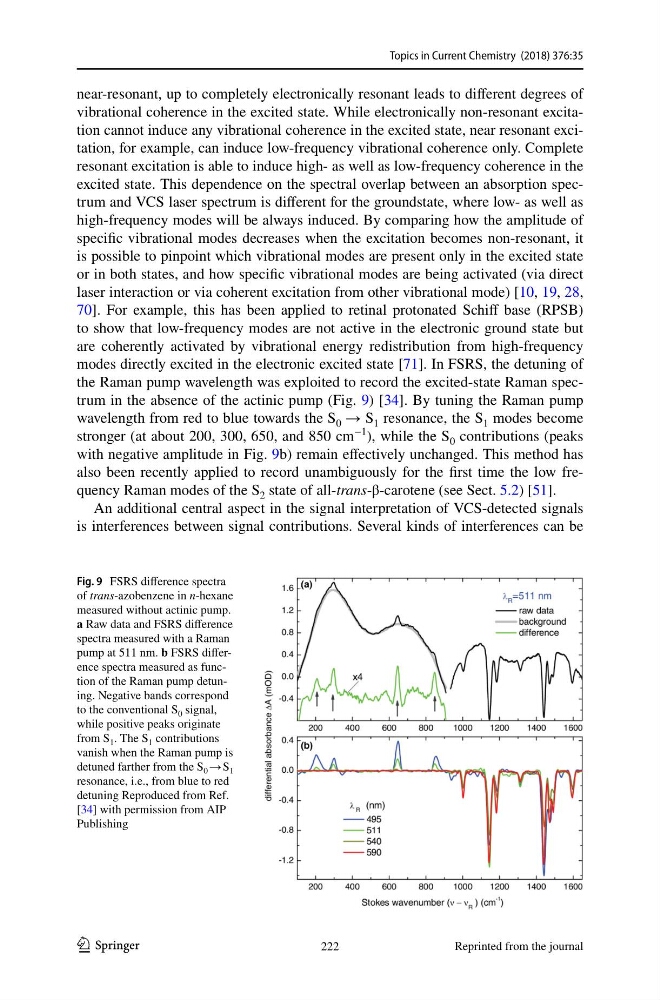
the Raman pump wavelength was exploited to record the excited-state Raman spectrum in the absence of the actinic pump (Fig. 9) [34]. By tuning the Raman pump
wavelength from red to blue towards the S 0 → S 1 resonance, the S 1 modes become
stronger (at about 200, 300, 650, and 850 cm
−1
), while the S 0 contributions (peaks
with negative amplitude in Fig. 9b) remain effectively unchanged. This method has
also been recently applied to record unambiguously for the first time the low frequency Raman modes of the S 2 state of all-trans-β-carotene (see Sect. 5.2) [51].
An additional central aspect in the signal interpretation of VCS-detected signals
is interferences between signal contributions. Several kinds of interferences can be
Fig. 9 FSRS difference spectra
of trans-azobenzene in n-hexane
measured without actinic pump.
a Raw data and FSRS difference
spectra measured with a Raman
pump at 511 nm. b FSRS difference spectra measured as function of the Raman pump detuning. Negative bands correspond
to the conventional S 0 signal,
while positive peaks originate
from S 1 . The S 1 contributions
vanish when the Raman pump is
detuned farther from the S 0 → S 1
resonance, i.e., from blue to red
detuning Reproduced from Ref.
[34] with permission from AIP
Publishing
222
Reprinted from the journal
1 3
near-resonant, up to completely electronically resonant leads to different degrees of
vibrational coherence in the excited state. While electronically non-resonant excitation cannot induce any vibrational coherence in the excited state, near resonant excitation, for example, can induce low-frequency vibrational coherence only. Complete
resonant excitation is able to induce high- as well as low-frequency coherence in the
excited state. This dependence on the spectral overlap between an absorption spectrum and VCS laser spectrum is different for the groundstate, where low- as well as
high-frequency modes will be always induced. By comparing how the amplitude of
specific vibrational modes decreases when the excitation becomes non-resonant, it
is possible to pinpoint which vibrational modes are present only in the excited state
or in both states, and how specific vibrational modes are being activated (via direct
laser interaction or via coherent excitation from other vibrational mode) [10, 19, 28,
70]. For example, this has been applied to retinal protonated Schiff base (RPSB)
to show that low-frequency modes are not active in the electronic ground state but
are coherently activated by vibrational energy redistribution from high-frequency
modes directly excited in the electronic excited state [71]. In FSRS, the detuning of
the Raman pump wavelength was exploited to record the excited-state Raman spectrum in the absence of the actinic pump (Fig. 9) [34]. By tuning the Raman pump
wavelength from red to blue towards the S 0 → S 1 resonance, the S 1 modes become
stronger (at about 200, 300, 650, and 850 cm
−1
), while the S 0 contributions (peaks
with negative amplitude in Fig. 9b) remain effectively unchanged. This method has
also been recently applied to record unambiguously for the first time the low frequency Raman modes of the S 2 state of all-trans-β-carotene (see Sect. 5.2) [51].
An additional central aspect in the signal interpretation of VCS-detected signals
is interferences between signal contributions. Several kinds of interferences can be
Fig. 9 FSRS difference spectra
of trans-azobenzene in n-hexane
measured without actinic pump.
a Raw data and FSRS difference
spectra measured with a Raman
pump at 511 nm. b FSRS difference spectra measured as function of the Raman pump detuning. Negative bands correspond
to the conventional S 0 signal,
while positive peaks originate
from S 1 . The S 1 contributions
vanish when the Raman pump is
detuned farther from the S 0 → S 1
resonance, i.e., from blue to red
detuning Reproduced from Ref.
[34] with permission from AIP
Publishing
222
Reprinted from the journal