

1 3
Topics in Current Chemistry (2018) 376:35
VCS laser spectrum. Importantly, when the VCS pump pulse(s), i.e., k 1 and k 2
in Figs. 2 or 3, are resonant with different electronic transitions from the same
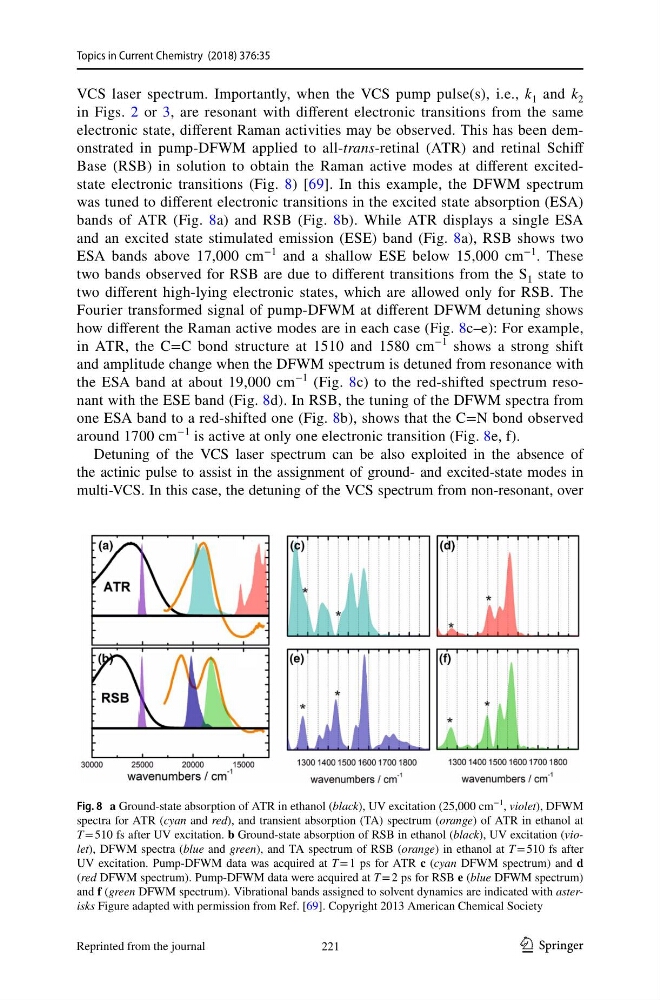
electronic state, different Raman activities may be observed. This has been demonstrated in pump-DFWM applied to all-trans-retinal (ATR) and retinal Schiff
Base (RSB) in solution to obtain the Raman active modes at different excitedstate electronic transitions (Fig. 8) [69]. In this example, the DFWM spectrum
was tuned to different electronic transitions in the excited state absorption (ESA)
bands of ATR (Fig. 8a) and RSB (Fig. 8b). While ATR displays a single ESA
and an excited state stimulated emission (ESE) band (Fig. 8a), RSB shows two
ESA bands above 17,000 cm
−1
and a shallow ESE below 15,000 cm
−1
. These
two bands observed for RSB are due to different transitions from the S 1 state to
two different high-lying electronic states, which are allowed only for RSB. The
Fourier transformed signal of pump-DFWM at different DFWM detuning shows
how different the Raman active modes are in each case (Fig. 8c–e): For example,
in ATR, the C=C bond structure at 1510 and 1580 cm
−1
shows a strong shift
and amplitude change when the DFWM spectrum is detuned from resonance with
the ESA band at about 19,000 cm
−1
(Fig. 8c) to the red-shifted spectrum resonant with the ESE band (Fig. 8d). In RSB, the tuning of the DFWM spectra from
one ESA band to a red-shifted one (Fig. 8b), shows that the C=N bond observed
around 1700 cm
−1
is active at only one electronic transition (Fig. 8e, f).
Detuning of the VCS laser spectrum can be also exploited in the absence of
the actinic pulse to assist in the assignment of ground- and excited-state modes in
multi-VCS. In this case, the detuning of the VCS spectrum from non-resonant, over
Fig. 8 a Ground-state absorption of ATR in ethanol (black), UV excitation (25,000 cm
−1 , violet), DFWM
spectra for ATR (cyan and red), and transient absorption (TA) spectrum (orange) of ATR in ethanol at
T = 510 fs after UV excitation. b Ground-state absorption of RSB in ethanol (black), UV excitation (violet), DFWM spectra (blue and green), and TA spectrum of RSB (orange) in ethanol at T = 510 fs after
UV excitation. Pump-DFWM data was acquired at T = 1 ps for ATR c (cyan DFWM spectrum) and d
(red DFWM spectrum). Pump-DFWM data were acquired at T = 2 ps for RSB e (blue DFWM spectrum)
and f (green DFWM spectrum). Vibrational bands assigned to solvent dynamics are indicated with asterisks Figure adapted with permission from Ref. [69]. Copyright 2013 American Chemical Society
221
Reprinted from the journal
Topics in Current Chemistry (2018) 376:35
VCS laser spectrum. Importantly, when the VCS pump pulse(s), i.e., k 1 and k 2
in Figs. 2 or 3, are resonant with different electronic transitions from the same
electronic state, different Raman activities may be observed. This has been demonstrated in pump-DFWM applied to all-trans-retinal (ATR) and retinal Schiff
Base (RSB) in solution to obtain the Raman active modes at different excitedstate electronic transitions (Fig. 8) [69]. In this example, the DFWM spectrum
was tuned to different electronic transitions in the excited state absorption (ESA)
bands of ATR (Fig. 8a) and RSB (Fig. 8b). While ATR displays a single ESA
and an excited state stimulated emission (ESE) band (Fig. 8a), RSB shows two
ESA bands above 17,000 cm
−1
and a shallow ESE below 15,000 cm
−1
. These
two bands observed for RSB are due to different transitions from the S 1 state to
two different high-lying electronic states, which are allowed only for RSB. The
Fourier transformed signal of pump-DFWM at different DFWM detuning shows
how different the Raman active modes are in each case (Fig. 8c–e): For example,
in ATR, the C=C bond structure at 1510 and 1580 cm
−1
shows a strong shift
and amplitude change when the DFWM spectrum is detuned from resonance with
the ESA band at about 19,000 cm
−1
(Fig. 8c) to the red-shifted spectrum resonant with the ESE band (Fig. 8d). In RSB, the tuning of the DFWM spectra from
one ESA band to a red-shifted one (Fig. 8b), shows that the C=N bond observed
around 1700 cm
−1
is active at only one electronic transition (Fig. 8e, f).
Detuning of the VCS laser spectrum can be also exploited in the absence of
the actinic pulse to assist in the assignment of ground- and excited-state modes in
multi-VCS. In this case, the detuning of the VCS spectrum from non-resonant, over
Fig. 8 a Ground-state absorption of ATR in ethanol (black), UV excitation (25,000 cm
−1 , violet), DFWM
spectra for ATR (cyan and red), and transient absorption (TA) spectrum (orange) of ATR in ethanol at
T = 510 fs after UV excitation. b Ground-state absorption of RSB in ethanol (black), UV excitation (violet), DFWM spectra (blue and green), and TA spectrum of RSB (orange) in ethanol at T = 510 fs after
UV excitation. Pump-DFWM data was acquired at T = 1 ps for ATR c (cyan DFWM spectrum) and d
(red DFWM spectrum). Pump-DFWM data were acquired at T = 2 ps for RSB e (blue DFWM spectrum)
and f (green DFWM spectrum). Vibrational bands assigned to solvent dynamics are indicated with asterisks Figure adapted with permission from Ref. [69]. Copyright 2013 American Chemical Society
221
Reprinted from the journal