

The two carbonyl groups are located at the two positions in the molecule, which are
most sensitive to the intramolecular hydrogen bond. Additional equilibrium 2D IR
spectra were used to show that these two amide-I modes are coupled in the molecule
and thus changes in the 3D structure of the molecule concerning the hydrogen bond
strongly affects this coupling. The time constant of that process was determined as
about 160 ps, which is considerably faster than predicted speed limits for contact
formation between side chains in related molecules.
Transient 2D IR spectroscopy has additionally been used to study properties of
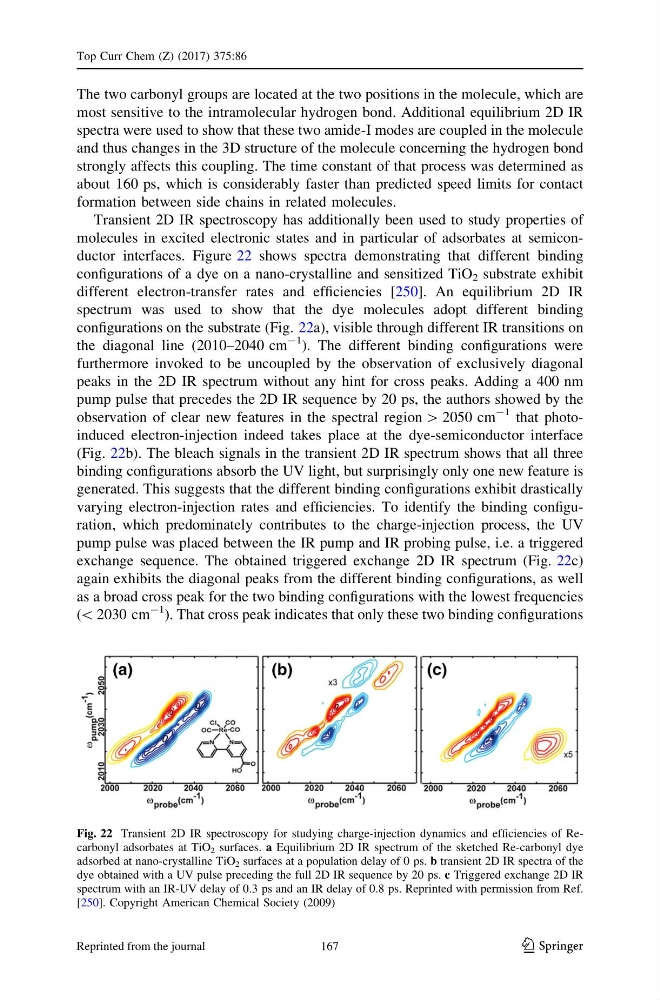
molecules in excited electronic states and in particular of adsorbates at semiconductor interfaces. Figure 22 shows spectra demonstrating that different binding
configurations of a dye on a nano-crystalline and sensitized TiO 2 substrate exhibit
different electron-transfer rates and efficiencies [250]. An equilibrium 2D IR
spectrum was used to show that the dye molecules adopt different binding
configurations on the substrate (Fig. 22a), visible through different IR transitions on
the diagonal line (2010–2040 cm
-1 ). The different binding configurations were
furthermore invoked to be uncoupled by the observation of exclusively diagonal
peaks in the 2D IR spectrum without any hint for cross peaks. Adding a 400 nm
pump pulse that precedes the 2D IR sequence by 20 ps, the authors showed by the
observation of clear new features in the spectral region [ 2050 cm
-1 that photoinduced electron-injection indeed takes place at the dye-semiconductor interface
(Fig. 22b). The bleach signals in the transient 2D IR spectrum shows that all three
binding configurations absorb the UV light, but surprisingly only one new feature is
generated. This suggests that the different binding configurations exhibit drastically
varying electron-injection rates and efficiencies. To identify the binding configuration, which predominately contributes to the charge-injection process, the UV
pump pulse was placed between the IR pump and IR probing pulse, i.e. a triggered
exchange sequence. The obtained triggered exchange 2D IR spectrum (Fig. 22c)
again exhibits the diagonal peaks from the different binding configurations, as well
as a broad cross peak for the two binding configurations with the lowest frequencies
(\ 2030 cm
-1 ). That cross peak indicates that only these two binding configurations
Fig. 22 Transient 2D IR spectroscopy for studying charge-injection dynamics and efficiencies of Recarbonyl adsorbates at TiO 2 surfaces. a Equilibrium 2D IR spectrum of the sketched Re-carbonyl dye
adsorbed at nano-crystalline TiO 2 surfaces at a population delay of 0 ps. b transient 2D IR spectra of the
dye obtained with a UV pulse preceding the full 2D IR sequence by 20 ps. c Triggered exchange 2D IR
spectrum with an IR-UV delay of 0.3 ps and an IR delay of 0.8 ps. Reprinted with permission from Ref.
[250]. Copyright American Chemical Society (2009)
Top Curr Chem (Z) (2017) 375:86
123
167
Reprinted from the journal
most sensitive to the intramolecular hydrogen bond. Additional equilibrium 2D IR
spectra were used to show that these two amide-I modes are coupled in the molecule
and thus changes in the 3D structure of the molecule concerning the hydrogen bond
strongly affects this coupling. The time constant of that process was determined as
about 160 ps, which is considerably faster than predicted speed limits for contact
formation between side chains in related molecules.
Transient 2D IR spectroscopy has additionally been used to study properties of
molecules in excited electronic states and in particular of adsorbates at semiconductor interfaces. Figure 22 shows spectra demonstrating that different binding
configurations of a dye on a nano-crystalline and sensitized TiO 2 substrate exhibit
different electron-transfer rates and efficiencies [250]. An equilibrium 2D IR
spectrum was used to show that the dye molecules adopt different binding
configurations on the substrate (Fig. 22a), visible through different IR transitions on
the diagonal line (2010–2040 cm
-1 ). The different binding configurations were
furthermore invoked to be uncoupled by the observation of exclusively diagonal
peaks in the 2D IR spectrum without any hint for cross peaks. Adding a 400 nm
pump pulse that precedes the 2D IR sequence by 20 ps, the authors showed by the
observation of clear new features in the spectral region [ 2050 cm
-1 that photoinduced electron-injection indeed takes place at the dye-semiconductor interface
(Fig. 22b). The bleach signals in the transient 2D IR spectrum shows that all three
binding configurations absorb the UV light, but surprisingly only one new feature is
generated. This suggests that the different binding configurations exhibit drastically
varying electron-injection rates and efficiencies. To identify the binding configuration, which predominately contributes to the charge-injection process, the UV
pump pulse was placed between the IR pump and IR probing pulse, i.e. a triggered
exchange sequence. The obtained triggered exchange 2D IR spectrum (Fig. 22c)
again exhibits the diagonal peaks from the different binding configurations, as well
as a broad cross peak for the two binding configurations with the lowest frequencies
(\ 2030 cm
-1 ). That cross peak indicates that only these two binding configurations
Fig. 22 Transient 2D IR spectroscopy for studying charge-injection dynamics and efficiencies of Recarbonyl adsorbates at TiO 2 surfaces. a Equilibrium 2D IR spectrum of the sketched Re-carbonyl dye
adsorbed at nano-crystalline TiO 2 surfaces at a population delay of 0 ps. b transient 2D IR spectra of the
dye obtained with a UV pulse preceding the full 2D IR sequence by 20 ps. c Triggered exchange 2D IR
spectrum with an IR-UV delay of 0.3 ps and an IR delay of 0.8 ps. Reprinted with permission from Ref.
[250]. Copyright American Chemical Society (2009)
Top Curr Chem (Z) (2017) 375:86
123
167
Reprinted from the journal