

bands are considerably affected in their spectral positions. One effect that
contributes to an almost instantaneous redshift of all bands is the transient
formation of heat in the molecule. The photolysis excites low-frequency modes in
the molecule, which are anharmonically coupled to the amide-I high-frequency
modes. A spectral redshift due to this heat generation can be seen in both the 1D and
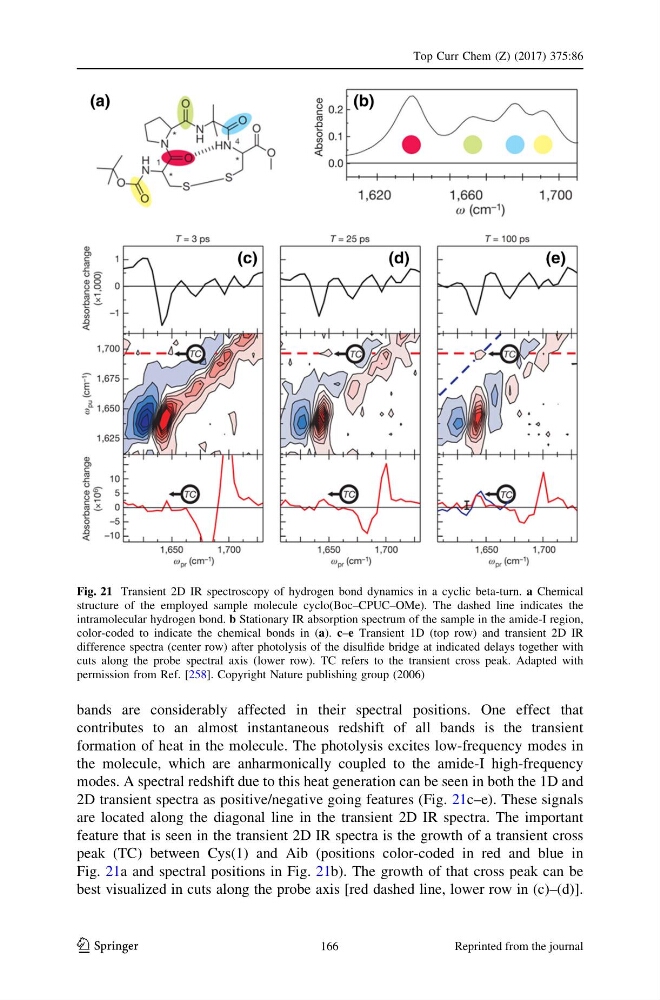
2D transient spectra as positive/negative going features (Fig. 21c–e). These signals
are located along the diagonal line in the transient 2D IR spectra. The important
feature that is seen in the transient 2D IR spectra is the growth of a transient cross
peak (TC) between Cys(1) and Aib (positions color-coded in red and blue in
Fig. 21a and spectral positions in Fig. 21b). The growth of that cross peak can be
best visualized in cuts along the probe axis [red dashed line, lower row in (c)–(d)].
Fig. 21 Transient 2D IR spectroscopy of hydrogen bond dynamics in a cyclic beta-turn. a Chemical
structure of the employed sample molecule cyclo(Boc–CPUC–OMe). The dashed line indicates the
intramolecular hydrogen bond. b Stationary IR absorption spectrum of the sample in the amide-I region,
color-coded to indicate the chemical bonds in (a). c–e Transient 1D (top row) and transient 2D IR
difference spectra (center row) after photolysis of the disulfide bridge at indicated delays together with
cuts along the probe spectral axis (lower row). TC refers to the transient cross peak. Adapted with
permission from Ref. [258]. Copyright Nature publishing group (2006)
Top Curr Chem (Z) (2017) 375:86
123
166
Reprinted from the journal
contributes to an almost instantaneous redshift of all bands is the transient
formation of heat in the molecule. The photolysis excites low-frequency modes in
the molecule, which are anharmonically coupled to the amide-I high-frequency
modes. A spectral redshift due to this heat generation can be seen in both the 1D and
2D transient spectra as positive/negative going features (Fig. 21c–e). These signals
are located along the diagonal line in the transient 2D IR spectra. The important
feature that is seen in the transient 2D IR spectra is the growth of a transient cross
peak (TC) between Cys(1) and Aib (positions color-coded in red and blue in
Fig. 21a and spectral positions in Fig. 21b). The growth of that cross peak can be
best visualized in cuts along the probe axis [red dashed line, lower row in (c)–(d)].
Fig. 21 Transient 2D IR spectroscopy of hydrogen bond dynamics in a cyclic beta-turn. a Chemical
structure of the employed sample molecule cyclo(Boc–CPUC–OMe). The dashed line indicates the
intramolecular hydrogen bond. b Stationary IR absorption spectrum of the sample in the amide-I region,
color-coded to indicate the chemical bonds in (a). c–e Transient 1D (top row) and transient 2D IR
difference spectra (center row) after photolysis of the disulfide bridge at indicated delays together with
cuts along the probe spectral axis (lower row). TC refers to the transient cross peak. Adapted with
permission from Ref. [258]. Copyright Nature publishing group (2006)
Top Curr Chem (Z) (2017) 375:86
123
166
Reprinted from the journal