

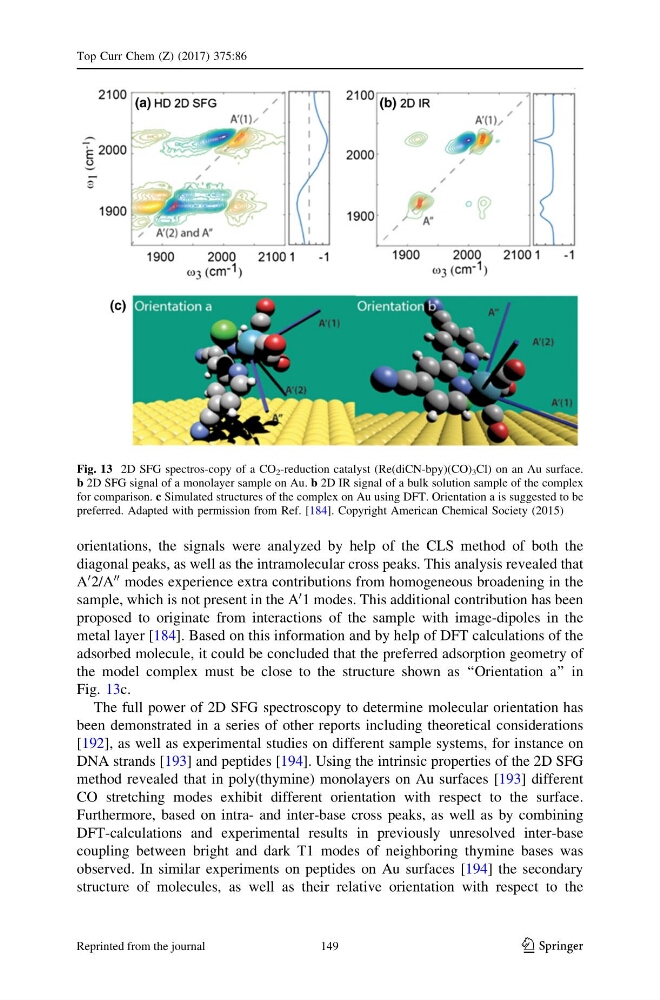
orientations, the signals were analyzed by help of the CLS method of both the
diagonal peaks, as well as the intramolecular cross peaks. This analysis revealed that
A
0 2/A
00 modes experience extra contributions from homogeneous broadening in the
sample, which is not present in the A
0 1 modes. This additional contribution has been
proposed to originate from interactions of the sample with image-dipoles in the
metal layer [184]. Based on this information and by help of DFT calculations of the
adsorbed molecule, it could be concluded that the preferred adsorption geometry of
the model complex must be close to the structure shown as ‘‘Orientation a’’ in
Fig. 13c.
The full power of 2D SFG spectroscopy to determine molecular orientation has
been demonstrated in a series of other reports including theoretical considerations
[192], as well as experimental studies on different sample systems, for instance on
DNA strands [193] and peptides [194]. Using the intrinsic properties of the 2D SFG
method revealed that in poly(thymine) monolayers on Au surfaces [193] different
CO stretching modes exhibit different orientation with respect to the surface.
Furthermore, based on intra- and inter-base cross peaks, as well as by combining
DFT-calculations and experimental results in previously unresolved inter-base
coupling between bright and dark T1 modes of neighboring thymine bases was
observed. In similar experiments on peptides on Au surfaces [194] the secondary
structure of molecules, as well as their relative orientation with respect to the
Fig. 13 2D SFG spectros-copy of a CO 2 -reduction catalyst (Re(diCN-bpy)(CO) 3 Cl) on an Au surface.
b 2D SFG signal of a monolayer sample on Au. b 2D IR signal of a bulk solution sample of the complex
for comparison. c Simulated structures of the complex on Au using DFT. Orientation a is suggested to be
preferred. Adapted with permission from Ref. [184]. Copyright American Chemical Society (2015)
Top Curr Chem (Z) (2017) 375:86
123
149
Reprinted from the journal
diagonal peaks, as well as the intramolecular cross peaks. This analysis revealed that
A
0 2/A
00 modes experience extra contributions from homogeneous broadening in the
sample, which is not present in the A
0 1 modes. This additional contribution has been
proposed to originate from interactions of the sample with image-dipoles in the
metal layer [184]. Based on this information and by help of DFT calculations of the
adsorbed molecule, it could be concluded that the preferred adsorption geometry of
the model complex must be close to the structure shown as ‘‘Orientation a’’ in
Fig. 13c.
The full power of 2D SFG spectroscopy to determine molecular orientation has
been demonstrated in a series of other reports including theoretical considerations
[192], as well as experimental studies on different sample systems, for instance on
DNA strands [193] and peptides [194]. Using the intrinsic properties of the 2D SFG
method revealed that in poly(thymine) monolayers on Au surfaces [193] different
CO stretching modes exhibit different orientation with respect to the surface.
Furthermore, based on intra- and inter-base cross peaks, as well as by combining
DFT-calculations and experimental results in previously unresolved inter-base
coupling between bright and dark T1 modes of neighboring thymine bases was
observed. In similar experiments on peptides on Au surfaces [194] the secondary
structure of molecules, as well as their relative orientation with respect to the
Fig. 13 2D SFG spectros-copy of a CO 2 -reduction catalyst (Re(diCN-bpy)(CO) 3 Cl) on an Au surface.
b 2D SFG signal of a monolayer sample on Au. b 2D IR signal of a bulk solution sample of the complex
for comparison. c Simulated structures of the complex on Au using DFT. Orientation a is suggested to be
preferred. Adapted with permission from Ref. [184]. Copyright American Chemical Society (2015)
Top Curr Chem (Z) (2017) 375:86
123
149
Reprinted from the journal