

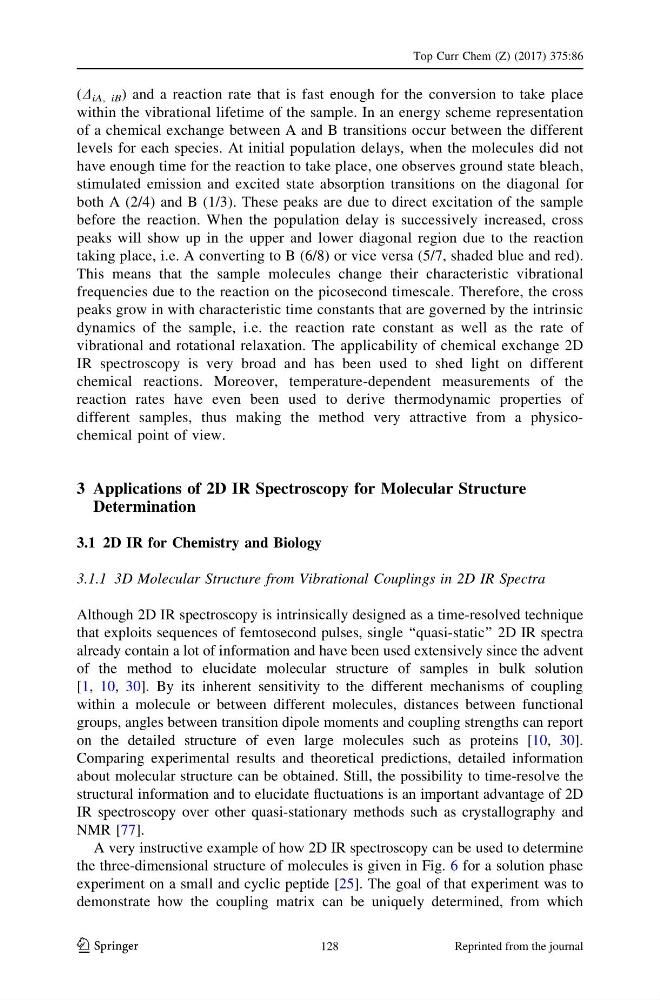
(D iA, iB ) and a reaction rate that is fast enough for the conversion to take place
within the vibrational lifetime of the sample. In an energy scheme representation
of a chemical exchange between A and B transitions occur between the different
levels for each species. At initial population delays, when the molecules did not
have enough time for the reaction to take place, one observes ground state bleach,
stimulated emission and excited state absorption transitions on the diagonal for
both A (2/4) and B (1/3). These peaks are due to direct excitation of the sample
before the reaction. When the population delay is successively increased, cross
peaks will show up in the upper and lower diagonal region due to the reaction
taking place, i.e. A converting to B (6/8) or vice versa (5/7, shaded blue and red).
This means that the sample molecules change their characteristic vibrational
frequencies due to the reaction on the picosecond timescale. Therefore, the cross
peaks grow in with characteristic time constants that are governed by the intrinsic
dynamics of the sample, i.e. the reaction rate constant as well as the rate of
vibrational and rotational relaxation. The applicability of chemical exchange 2D
IR spectroscopy is very broad and has been used to shed light on different
chemical reactions. Moreover, temperature-dependent measurements of the
reaction rates have even been used to derive thermodynamic properties of
different samples, thus making the method very attractive from a physicochemical point of view.
3 Applications of 2D IR Spectroscopy for Molecular Structure
Determination
3.1 2D IR for Chemistry and Biology
3.1.1 3D Molecular Structure from Vibrational Couplings in 2D IR Spectra
Although 2D IR spectroscopy is intrinsically designed as a time-resolved technique
that exploits sequences of femtosecond pulses, single ‘‘quasi-static’’ 2D IR spectra
already contain a lot of information and have been used extensively since the advent
of the method to elucidate molecular structure of samples in bulk solution
[1, 10, 30]. By its inherent sensitivity to the different mechanisms of coupling
within a molecule or between different molecules, distances between functional
groups, angles between transition dipole moments and coupling strengths can report
on the detailed structure of even large molecules such as proteins [10, 30].
Comparing experimental results and theoretical predictions, detailed information
about molecular structure can be obtained. Still, the possibility to time-resolve the
structural information and to elucidate fluctuations is an important advantage of 2D
IR spectroscopy over other quasi-stationary methods such as crystallography and
NMR [77].
A very instructive example of how 2D IR spectroscopy can be used to determine
the three-dimensional structure of molecules is given in Fig. 6 for a solution phase
experiment on a small and cyclic peptide [25]. The goal of that experiment was to
demonstrate how the coupling matrix can be uniquely determined, from which
Top Curr Chem (Z) (2017) 375:86
123
128
Reprinted from the journal
within the vibrational lifetime of the sample. In an energy scheme representation
of a chemical exchange between A and B transitions occur between the different
levels for each species. At initial population delays, when the molecules did not
have enough time for the reaction to take place, one observes ground state bleach,
stimulated emission and excited state absorption transitions on the diagonal for
both A (2/4) and B (1/3). These peaks are due to direct excitation of the sample
before the reaction. When the population delay is successively increased, cross
peaks will show up in the upper and lower diagonal region due to the reaction
taking place, i.e. A converting to B (6/8) or vice versa (5/7, shaded blue and red).
This means that the sample molecules change their characteristic vibrational
frequencies due to the reaction on the picosecond timescale. Therefore, the cross
peaks grow in with characteristic time constants that are governed by the intrinsic
dynamics of the sample, i.e. the reaction rate constant as well as the rate of
vibrational and rotational relaxation. The applicability of chemical exchange 2D
IR spectroscopy is very broad and has been used to shed light on different
chemical reactions. Moreover, temperature-dependent measurements of the
reaction rates have even been used to derive thermodynamic properties of
different samples, thus making the method very attractive from a physicochemical point of view.
3 Applications of 2D IR Spectroscopy for Molecular Structure
Determination
3.1 2D IR for Chemistry and Biology
3.1.1 3D Molecular Structure from Vibrational Couplings in 2D IR Spectra
Although 2D IR spectroscopy is intrinsically designed as a time-resolved technique
that exploits sequences of femtosecond pulses, single ‘‘quasi-static’’ 2D IR spectra
already contain a lot of information and have been used extensively since the advent
of the method to elucidate molecular structure of samples in bulk solution
[1, 10, 30]. By its inherent sensitivity to the different mechanisms of coupling
within a molecule or between different molecules, distances between functional
groups, angles between transition dipole moments and coupling strengths can report
on the detailed structure of even large molecules such as proteins [10, 30].
Comparing experimental results and theoretical predictions, detailed information
about molecular structure can be obtained. Still, the possibility to time-resolve the
structural information and to elucidate fluctuations is an important advantage of 2D
IR spectroscopy over other quasi-stationary methods such as crystallography and
NMR [77].
A very instructive example of how 2D IR spectroscopy can be used to determine
the three-dimensional structure of molecules is given in Fig. 6 for a solution phase
experiment on a small and cyclic peptide [25]. The goal of that experiment was to
demonstrate how the coupling matrix can be uniquely determined, from which
Top Curr Chem (Z) (2017) 375:86
123
128
Reprinted from the journal