

1 3
Top Curr Chem (Z) (2018) 376:24
From experimental observations, it is known that in pyrene, after L a excitation, an
ultrafast population transfer towards a lower-lying state (namely L b ) takes place with
a time constant of 85 fs [16]. This state is spectroscopically dark; therefore, the population remains trapped on a nanosecond timescale before it eventually decays to the
GS through fluorescence with a high quantum yield [102, 103]. Recent excited-state
molecular dynamics simulations [93] have revealed the mechanism of non-adiabatic
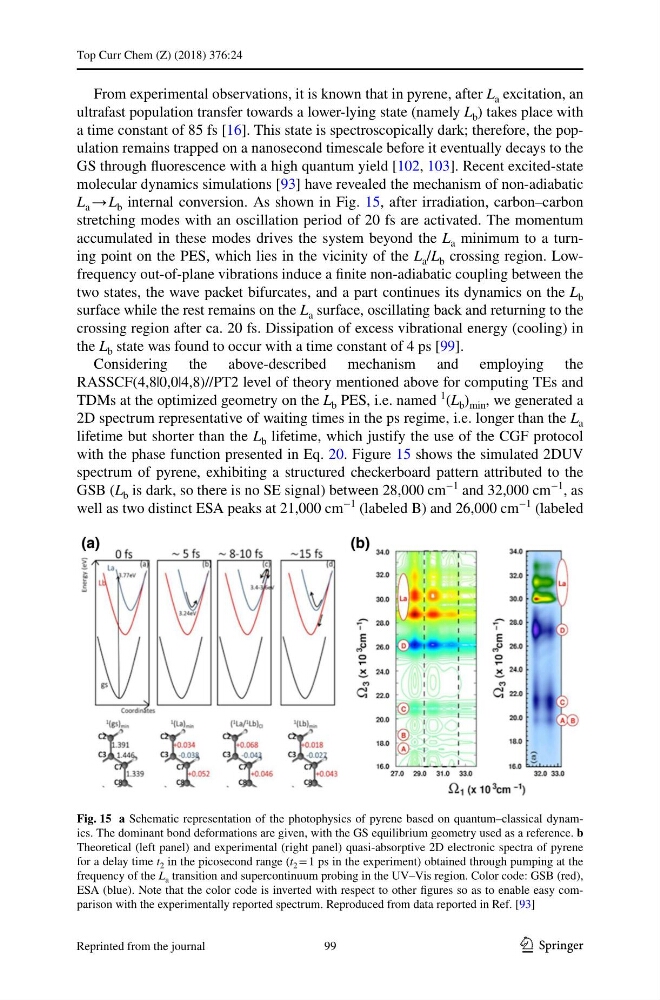
L a → L b internal conversion. As shown in Fig. 15, after irradiation, carbon–carbon
stretching modes with an oscillation period of 20 fs are activated. The momentum
accumulated in these modes drives the system beyond the L a minimum to a turning point on the PES, which lies in the vicinity of the L a /L b crossing region. Lowfrequency out-of-plane vibrations induce a finite non-adiabatic coupling between the
two states, the wave packet bifurcates, and a part continues its dynamics on the L b
surface while the rest remains on the L a surface, oscillating back and returning to the
crossing region after ca. 20 fs. Dissipation of excess vibrational energy (cooling) in
the L b state was found to occur with a time constant of 4 ps [99].
Considering the above-described mechanism and employing the
RASSCF(4,8|0,0|4,8)//PT2 level of theory mentioned above for computing TEs and
TDMs at the optimized geometry on the L b PES, i.e. named
1
(L b ) min , we generated a
2D spectrum representative of waiting times in the ps regime, i.e. longer than the L a
lifetime but shorter than the L b lifetime, which justify the use of the CGF protocol
with the phase function presented in Eq. 20. Figure 15 shows the simulated 2DUV
spectrum of pyrene, exhibiting a structured checkerboard pattern attributed to the
GSB (L b is dark, so there is no SE signal) between 28,000 cm
−1
and 32,000 cm
−1
, as
well as two distinct ESA peaks at 21,000 cm
−1
(labeled B) and 26,000 cm
−1
(labeled
Fig. 15 a Schematic representation of the photophysics of pyrene based on quantum–classical dynamics. The dominant bond deformations are given, with the GS equilibrium geometry used as a reference. b
Theoretical (left panel) and experimental (right panel) quasi-absorptive 2D electronic spectra of pyrene
for a delay time t 2 in the picosecond range (t 2 = 1 ps in the experiment) obtained through pumping at the
frequency of the L a transition and supercontinuum probing in the UV–Vis region. Color code: GSB (red),
ESA (blue). Note that the color code is inverted with respect to other figures so as to enable easy comparison with the experimentally reported spectrum. Reproduced from data reported in Ref. [93]
99
Reprinted from the journal
Top Curr Chem (Z) (2018) 376:24
From experimental observations, it is known that in pyrene, after L a excitation, an
ultrafast population transfer towards a lower-lying state (namely L b ) takes place with
a time constant of 85 fs [16]. This state is spectroscopically dark; therefore, the population remains trapped on a nanosecond timescale before it eventually decays to the
GS through fluorescence with a high quantum yield [102, 103]. Recent excited-state
molecular dynamics simulations [93] have revealed the mechanism of non-adiabatic
L a → L b internal conversion. As shown in Fig. 15, after irradiation, carbon–carbon
stretching modes with an oscillation period of 20 fs are activated. The momentum
accumulated in these modes drives the system beyond the L a minimum to a turning point on the PES, which lies in the vicinity of the L a /L b crossing region. Lowfrequency out-of-plane vibrations induce a finite non-adiabatic coupling between the
two states, the wave packet bifurcates, and a part continues its dynamics on the L b
surface while the rest remains on the L a surface, oscillating back and returning to the
crossing region after ca. 20 fs. Dissipation of excess vibrational energy (cooling) in
the L b state was found to occur with a time constant of 4 ps [99].
Considering the above-described mechanism and employing the
RASSCF(4,8|0,0|4,8)//PT2 level of theory mentioned above for computing TEs and
TDMs at the optimized geometry on the L b PES, i.e. named
1
(L b ) min , we generated a
2D spectrum representative of waiting times in the ps regime, i.e. longer than the L a
lifetime but shorter than the L b lifetime, which justify the use of the CGF protocol
with the phase function presented in Eq. 20. Figure 15 shows the simulated 2DUV
spectrum of pyrene, exhibiting a structured checkerboard pattern attributed to the
GSB (L b is dark, so there is no SE signal) between 28,000 cm
−1
and 32,000 cm
−1
, as
well as two distinct ESA peaks at 21,000 cm
−1
(labeled B) and 26,000 cm
−1
(labeled
Fig. 15 a Schematic representation of the photophysics of pyrene based on quantum–classical dynamics. The dominant bond deformations are given, with the GS equilibrium geometry used as a reference. b
Theoretical (left panel) and experimental (right panel) quasi-absorptive 2D electronic spectra of pyrene
for a delay time t 2 in the picosecond range (t 2 = 1 ps in the experiment) obtained through pumping at the
frequency of the L a transition and supercontinuum probing in the UV–Vis region. Color code: GSB (red),
ESA (blue). Note that the color code is inverted with respect to other figures so as to enable easy comparison with the experimentally reported spectrum. Reproduced from data reported in Ref. [93]
99
Reprinted from the journal