

Top Curr Chem (Z) (2018) 376:24
1 3
[86]. As an example case study, we very recently [61] performed 2DUV spectra simulations of the adenine–adenine monophosphate dinucleoside (ApA) in
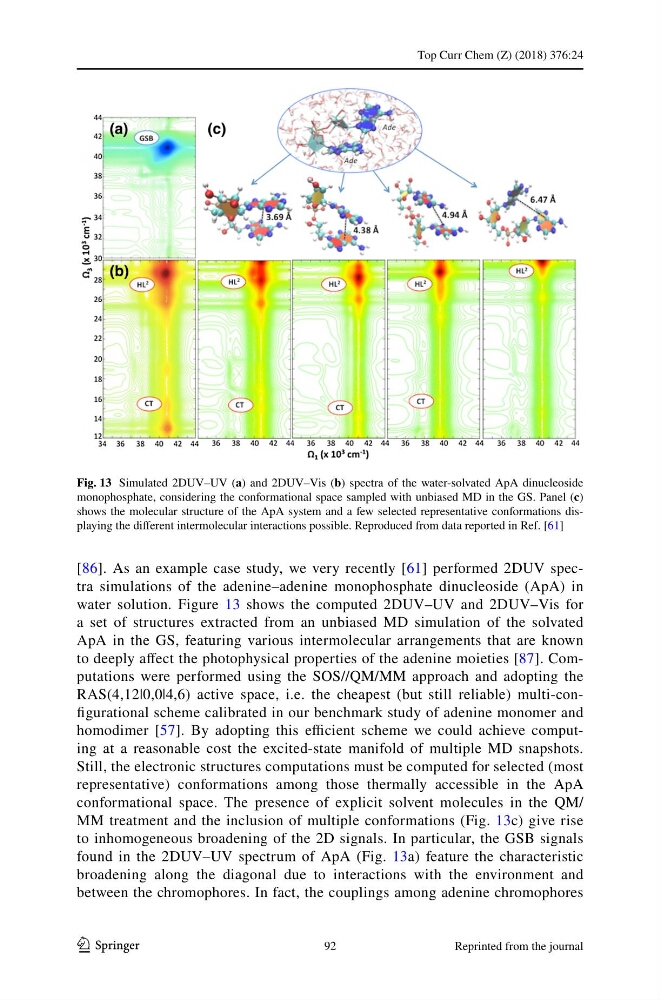
water solution. Figure 13 shows the computed 2DUV–UV and 2DUV–Vis for
a set of structures extracted from an unbiased MD simulation of the solvated
ApA in the GS, featuring various intermolecular arrangements that are known
to deeply affect the photophysical properties of the adenine moieties [87]. Computations were performed using the SOS//QM/MM approach and adopting the
RAS(4,12|0,0|4,6) active space, i.e. the cheapest (but still reliable) multi-configurational scheme calibrated in our benchmark study of adenine monomer and
homodimer [57]. By adopting this efficient scheme we could achieve computing at a reasonable cost the excited-state manifold of multiple MD snapshots.
Still, the electronic structures computations must be computed for selected (most
representative) conformations among those thermally accessible in the ApA
conformational space. The presence of explicit solvent molecules in the QM/
MM treatment and the inclusion of multiple conformations (Fig. 13c) give rise
to inhomogeneous broadening of the 2D signals. In particular, the GSB signals
found in the 2DUV–UV spectrum of ApA (Fig. 13a) feature the characteristic
broadening along the diagonal due to interactions with the environment and
between the chromophores. In fact, the couplings among adenine chromophores
Fig. 13 Simulated 2DUV–UV (a) and 2DUV–Vis (b) spectra of the water-solvated ApA dinucleoside
monophosphate, considering the conformational space sampled with unbiased MD in the GS. Panel (c)
shows the molecular structure of the ApA system and a few selected representative conformations displaying the different intermolecular interactions possible. Reproduced from data reported in Ref. [61]
92
Reprinted from the journal
1 3
[86]. As an example case study, we very recently [61] performed 2DUV spectra simulations of the adenine–adenine monophosphate dinucleoside (ApA) in
water solution. Figure 13 shows the computed 2DUV–UV and 2DUV–Vis for
a set of structures extracted from an unbiased MD simulation of the solvated
ApA in the GS, featuring various intermolecular arrangements that are known
to deeply affect the photophysical properties of the adenine moieties [87]. Computations were performed using the SOS//QM/MM approach and adopting the
RAS(4,12|0,0|4,6) active space, i.e. the cheapest (but still reliable) multi-configurational scheme calibrated in our benchmark study of adenine monomer and
homodimer [57]. By adopting this efficient scheme we could achieve computing at a reasonable cost the excited-state manifold of multiple MD snapshots.
Still, the electronic structures computations must be computed for selected (most
representative) conformations among those thermally accessible in the ApA
conformational space. The presence of explicit solvent molecules in the QM/
MM treatment and the inclusion of multiple conformations (Fig. 13c) give rise
to inhomogeneous broadening of the 2D signals. In particular, the GSB signals
found in the 2DUV–UV spectrum of ApA (Fig. 13a) feature the characteristic
broadening along the diagonal due to interactions with the environment and
between the chromophores. In fact, the couplings among adenine chromophores
Fig. 13 Simulated 2DUV–UV (a) and 2DUV–Vis (b) spectra of the water-solvated ApA dinucleoside
monophosphate, considering the conformational space sampled with unbiased MD in the GS. Panel (c)
shows the molecular structure of the ApA system and a few selected representative conformations displaying the different intermolecular interactions possible. Reproduced from data reported in Ref. [61]
92
Reprinted from the journal