

74
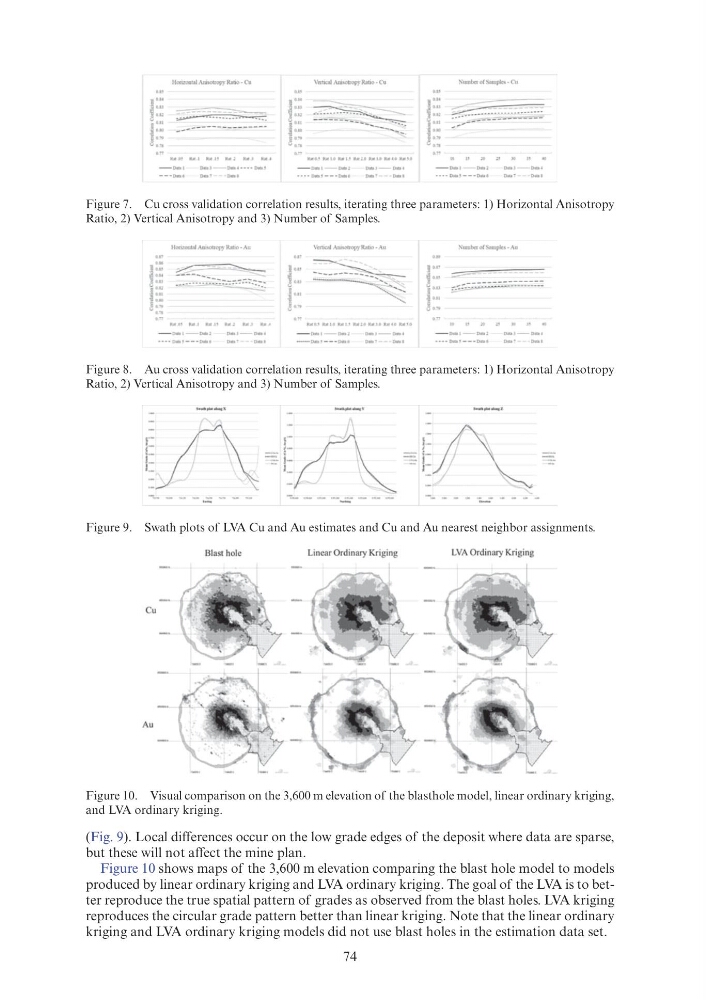
(Fig. 9). Local differences occur on the low grade edges of the deposit where data are sparse,
but these will not affect the mine plan.
Figure 10 shows maps of the 3,600 m elevation comparing the blast hole model to models
produced by linear ordinary kriging and LVA ordinary kriging. The goal of the LVA is to better reproduce the true spatial pattern of grades as observed from the blast holes. LVA kriging
reproduces the circular grade pattern better than linear kriging. Note that the linear ordinary
kriging and LVA ordinary kriging models did not use blast holes in the estimation data set.
Figure 7. Cu cross validation correlation results, iterating three parameters: 1) Horizontal Anisotropy
Ratio, 2) Vertical Anisotropy and 3) Number of Samples.
Figure 8. Au cross validation correlation results, iterating three parameters: 1) Horizontal Anisotropy
Ratio, 2) Vertical Anisotropy and 3) Number of Samples.
Figure 9. Swath plots of LVA Cu and Au estimates and Cu and Au nearest neighbor assignments.
Figure 10. Visual comparison on the 3,600 m elevation of the blasthole model, linear ordinary kriging,
and LVA ordinary kriging.
llonzontal Anisotropy Ratio- Cu
l lorizontal Anisotropy Ratto- Au
Blast hole
Cu
Au
.;Ol.l
~
~UJ
j O.fl
So.79
\'emcal Anisotropy Ratto- Ctt
Nmnbt:rofSamples -Cu
~ ~
Verttcal Amwtropy Ralio- Au
NmnberofSamples-Au
~;:;..;-_~-------------Linear Ordinary Kriging
LVA Ordinary Kriging
(Fig. 9). Local differences occur on the low grade edges of the deposit where data are sparse,
but these will not affect the mine plan.
Figure 10 shows maps of the 3,600 m elevation comparing the blast hole model to models
produced by linear ordinary kriging and LVA ordinary kriging. The goal of the LVA is to better reproduce the true spatial pattern of grades as observed from the blast holes. LVA kriging
reproduces the circular grade pattern better than linear kriging. Note that the linear ordinary
kriging and LVA ordinary kriging models did not use blast holes in the estimation data set.
Figure 7. Cu cross validation correlation results, iterating three parameters: 1) Horizontal Anisotropy
Ratio, 2) Vertical Anisotropy and 3) Number of Samples.
Figure 8. Au cross validation correlation results, iterating three parameters: 1) Horizontal Anisotropy
Ratio, 2) Vertical Anisotropy and 3) Number of Samples.
Figure 9. Swath plots of LVA Cu and Au estimates and Cu and Au nearest neighbor assignments.
Figure 10. Visual comparison on the 3,600 m elevation of the blasthole model, linear ordinary kriging,
and LVA ordinary kriging.
llonzontal Anisotropy Ratio- Cu
l lorizontal Anisotropy Ratto- Au
Blast hole
Cu
Au
.;Ol.l
~
~UJ
j O.fl
So.79
\'emcal Anisotropy Ratto- Ctt
Nmnbt:rofSamples -Cu
~ ~
Verttcal Amwtropy Ralio- Au
NmnberofSamples-Au
~;:;..;-_~-------------Linear Ordinary Kriging
LVA Ordinary Kriging