

676
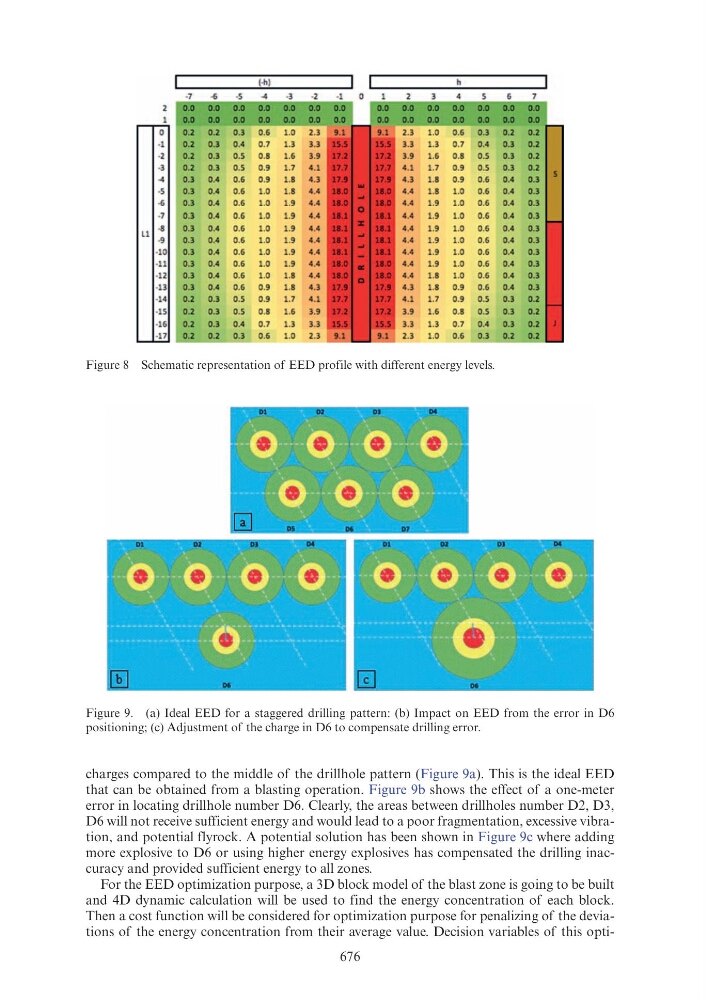
charges compared to the middle of the drillhole pattern (Figure 9a). This is the ideal EED
that can be obtained from a blasting operation. Figure 9b shows the effect of a one-meter
error in locating drillhole number D6. Clearly, the areas between drillholes number D2, D3,
D6 will not receive sufficient energy and would lead to a poor fragmentation, excessive vibration, and potential flyrock. A potential solution has been shown in Figure 9c where adding
more explosive to D6 or using higher energy explosives has compensated the drilling inaccuracy and provided sufficient energy to all zones.
For the EED optimization purpose, a 3D block model of the blast zone is going to be built
and 4D dynamic calculation will be used to find the energy concentration of each block.
Then a cost function will be considered for optimization purpose for penalizing of the deviations of the energy concentration from their average value. Decision variables of this optiFigure 8 Schematic representation of EED profile with different energy levels.
Figure 9. (a) Ideal EED for a staggered drilling pattern: (b) Impact on EED from the error in D6
positioning; (c) Adjustment of the charge in D6 to compensate drilling error.
0
0.2
0 .2
0.3
0 .6
1.0
1.0
0.6
0 .3
0.2
· 1
0 .2
0.3
0 .4
0.7
1.3
1.3
0.7
0 .4
0 .3
-2
0.2
0 .3
0 .5
0.8
1.6
1.6
0.8
0 .5
0.3
·3
0 .2
0.3
0 .5
0.9
1.7
1.7
0.9
0 .5
0 .3
-4
0 .3
0 .4
0 .6
0.9
1.8
1.8
0.9
0 .6
0 .4
·5
0 .3
0.4
0.6
1.0
1.8
1.8
1.0
0 .6
0.4
~
0 .3
0 .4
0 .6
1.0
1.9
1.9
1.0
0.6
0 .4
-7
0.3
0.4
0.6
1.0
1.9
1.9
1.0
0.6
0.4
Ll
-8
0 .3
0 .4
0.6
1.0
1.9
1.9
1.0
0.6
0 .4
·9
0 .3
0.4
0 .6
1.0
1.9
1.9
1.0
0.6
0 .4
-10
0 .3
0 .4
0.6
1.0
1.9
1.9
1.0
0.6
0 .4
·11
0 .3
0.4
0 .6
1.0
1.9
1.9
1.0
0 .6
0.4
·12
0 .3
0 .4
0.6
1.0
1.8
1.8
1.0
0 .6
0 .4
-13
0 .3
0.4
0 .6
0.9
1.8
1.8
0.9
0 .6
0 .4
-14
0 .2
0 .3
0 .5
0.9
1.7
1.7
0.9
0.5
0.3
-15
0 .2
0.3
0 .5
0.8
1.6
1.6
0.8
0.5
0 .3
·16
0.2
0.3
0 .4
0 .7
1.3
1.3
0.7
0 .4
0 .3
-17
0.2
0.2
0 .3
0 .6
1.0
1.0
0.6
0 .3
0 .2