

675
2.4 Drilling accuracy
The detected drillholes by Image Processing and/or Machine Learning are compared against
their designed locations. Figure 6 shows the deviations of the as-built drilling operation from
the designed configuration. The real drillholes and their designed locations are displayed in
red and green respectively. It reveals that the errors can even reach to the level of 1 meter in
the case study.
3 EXPLOSIVE ENERGY DISTRIBUTION (EED)
Simulation of EED is a known process for blasters to analyze blasting performance and
ensure its safety and productivity. In contrast with sophisticated thermodynamically/thermophysical models, blasting engineers have a simplified approach based on the powder factor
which is also used in current research project. Generally, the powder factor is just an average
for the entire blast, and do not clearly reflects variations in burden, spacing, bench height,
hole diameter, charge length or explosive energy in particular areas of the blasting. In this
approach, a small portion of the charge is considered and its resulting explosive energy concentration at point P at the distance of r from the charge segment is calculated using Eq. (1)
(JKTech, 2012).
P
D
h
L
r
L
r
r
−
D
⎛
⎝ ⎜
⎛ ⎛
⎝ ⎝
⎞
⎠ ⎟
⎞ ⎞
⎠ ⎠
187 5
1
2
2
2
L L
2
r r
1
L L
1
r r
.
ρ
ρ
(1)
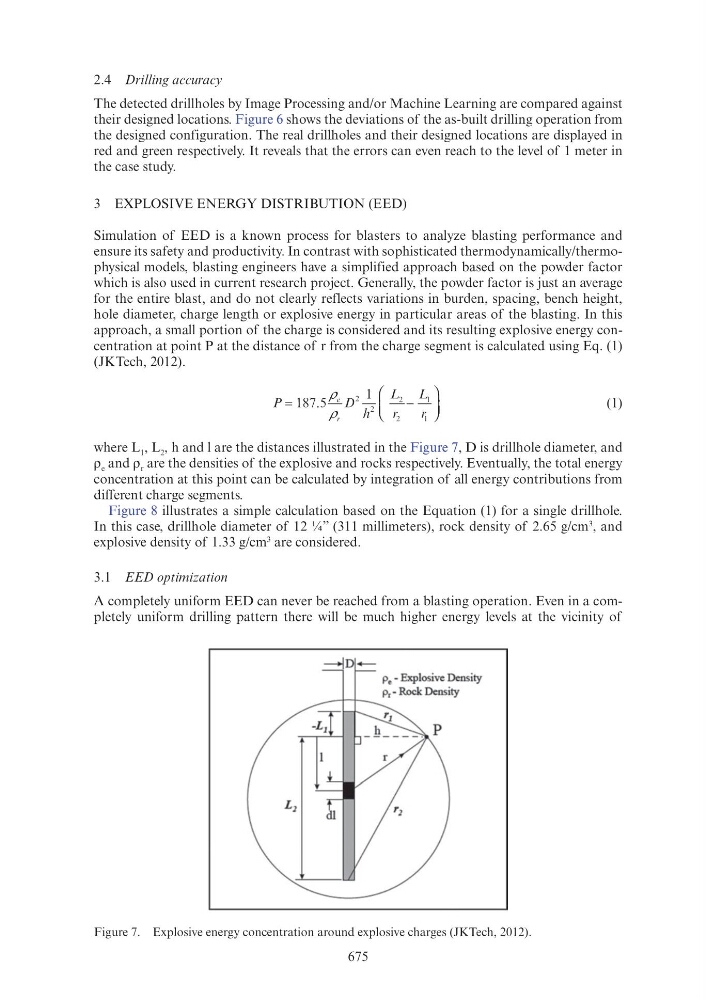
where L 1 , L 2 , h and l are the distances illustrated in the Figure 7, D is drillhole diameter, and
ρ e and ρ r are the densities of the explosive and rocks respectively. Eventually, the total energy
concentration at this point can be calculated by integration of all energy contributions from
different charge segments.
Figure 8 illustrates a simple calculation based on the Equation (1) for a single drillhole.
In this case, drillhole diameter of 12 ¼” (311 millimeters), rock density of 2.65 g/cm
3 , and
explosive density of 1.33 g/cm
3 are considered.
3.1 EED optimization
A completely uniform EED can never be reached from a blasting operation. Even in a completely uniform drilling pattern there will be much higher energy levels at the vicinity of
Figure 7. Explosive energy concentration around explosive charges (JKTech, 2012).
----r---r-Pe - Explosive Density
Pr- Rock Density