

672
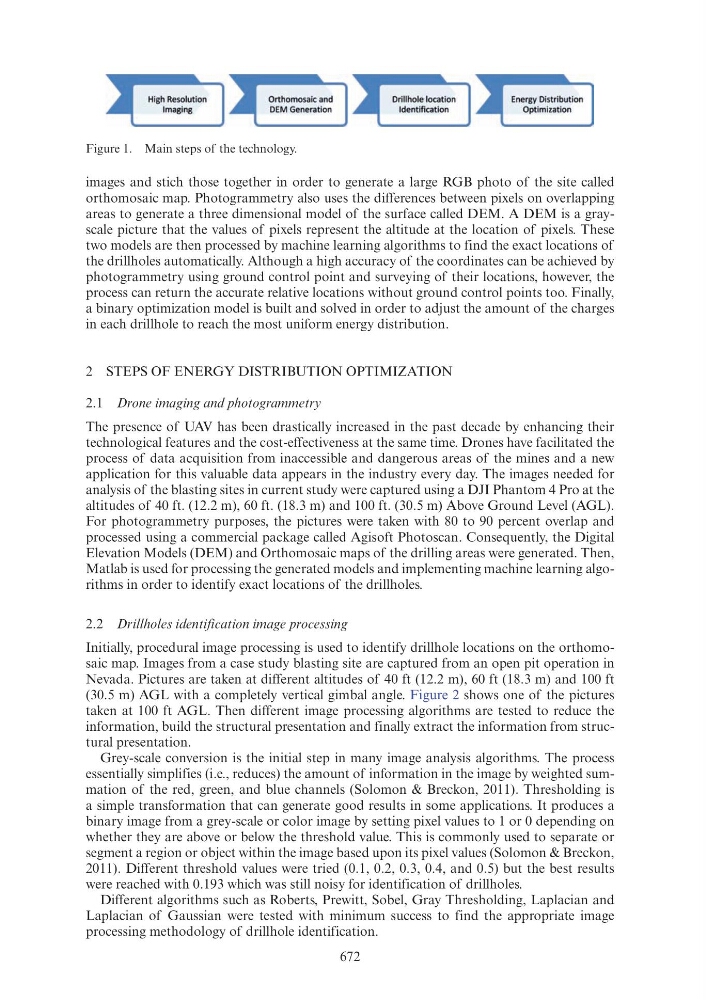
images and stich those together in order to generate a large RGB photo of the site called
orthomosaic map. Photogrammetry also uses the differences between pixels on overlapping
areas to generate a three dimensional model of the surface called DEM. A DEM is a grayscale picture that the values of pixels represent the altitude at the location of pixels. These
two models are then processed by machine learning algorithms to find the exact locations of
the drillholes automatically. Although a high accuracy of the coordinates can be achieved by
photogrammetry using ground control point and surveying of their locations, however, the
process can return the accurate relative locations without ground control points too. Finally,
a binary optimization model is built and solved in order to adjust the amount of the charges
in each drillhole to reach the most uniform energy distribution.
2 STEPS OF ENERGY DISTRIBUTION OPTIMIZATION
2.1 Drone imaging and photogrammetry
The presence of UAV has been drastically increased in the past decade by enhancing their
technological features and the cost-effectiveness at the same time. Drones have facilitated the
process of data acquisition from inaccessible and dangerous areas of the mines and a new
application for this valuable data appears in the industry every day. The images needed for
analysis of the blasting sites in current study were captured using a DJI Phantom 4 Pro at the
altitudes of 40 ft. (12.2 m), 60 ft. (18.3 m) and 100 ft. (30.5 m) Above Ground Level (AGL).
For photogrammetry purposes, the pictures were taken with 80 to 90 percent overlap and
processed using a commercial package called Agisoft Photoscan. Consequently, the Digital
Elevation Models (DEM) and Orthomosaic maps of the drilling areas were generated. Then,
Matlab is used for processing the generated models and implementing machine learning algorithms in order to identify exact locations of the drillholes.
2.2 Drillholes identification image processing
Initially, procedural image processing is used to identify drillhole locations on the orthomosaic map. Images from a case study blasting site are captured from an open pit operation in
Nevada. Pictures are taken at different altitudes of 40 ft (12.2 m), 60 ft (18.3 m) and 100 ft
(30.5 m) AGL with a completely vertical gimbal angle. Figure 2 shows one of the pictures
taken at 100 ft AGL. Then different image processing algorithms are tested to reduce the
information, build the structural presentation and finally extract the information from structural presentation.
Grey-scale conversion is the initial step in many image analysis algorithms. The process
essentially simplifies (i.e., reduces) the amount of information in the image by weighted summation of the red, green, and blue channels (Solomon & Breckon, 2011). Thresholding is
a simple transformation that can generate good results in some applications. It produces a
binary image from a grey-scale or color image by setting pixel values to 1 or 0 depending on
whether they are above or below the threshold value. This is commonly used to separate or
segment a region or object within the image based upon its pixel values (Solomon & Breckon,
2011). Different threshold values were tried (0.1, 0.2, 0.3, 0.4, and 0.5) but the best results
were reached with 0.193 which was still noisy for identification of drillholes.
Different algorithms such as Roberts, Prewitt, Sobel, Gray Thresholding, Laplacian and
Laplacian of Gaussian were tested with minimum success to find the appropriate image
processing methodology of drillhole identification.
Figure 1. Main steps of the technology.
High Resol ution
Imaging
Orthomosaic and
OEM Generation
Drillhole location
Identificat ion
Energy Distribution
Optimizat ion