

642
PCS C C
L
I
I
d
( )
T ( ) = −
⎛
⎝ ⎜
⎛ ⎛
⎝ ⎝
⎞
⎠ ⎟
⎞ ⎞
⎠ ⎠
=
−∞
∞
∫
φ( )
λ
ln
A
0
I I
(2)
Therefore, the gas concentration can be directly calculated by the following formula
C
I
I
d
PS
L
A
PS
L
=
−
⎛
⎝ ⎜
⎛ ⎛
⎝ ⎝
⎞
⎠ ⎟
⎞ ⎞
⎠ ⎠
( )
T ( )
=
( )
T ( )
−∞
∞
∫ ln
0
I I
λ
φ( )
φ( )
(3)
In the case where parameters such as pressure P, absorption line intensity S(T) and effective length of gas absorption L are known, the integrated value of − ln( / )
I
/ 0
I I in the frequency
domain is brought into the equation (3) and the gas concentration value C can be finally
obtained. Normally, the spectral absorption signal is integrated after a corresponding linear
function is used for fitting the measured data. The integral value is then accurately calculated
from the line fitting data and the influence of the measurement error cane reduced. Assuming that the pressure and absorption line of a gas are a constant in the actual sensor design
and the concentration of the gas can be measured only by measuring the change of the light
intensity before and after the gas absorption. In order to improve the accuracy and reliability
of the measurement, temperature and pressure compensation are required (Li, Zhao).
3 PIPELINE WIRELESS LASER METHANE SENSOR MONITERING SYSTEM
The Internet of Things (IoT) is an important part of the new generation of information technology and an important development in the era of information. The use of IoT technology
in gas drainage pipelines is also an advancement and new area. To obtain the gas concentration data of gas drainage pipelines at any time and at anywhere it very important for coal
mine industry.
3.1 System structures
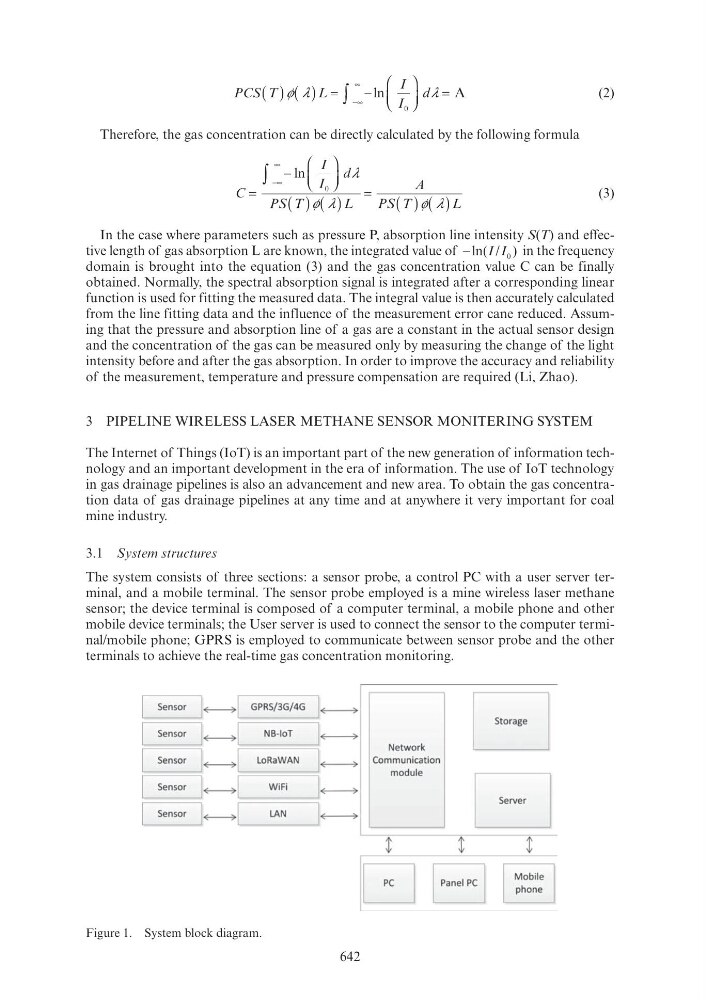
The system consists of three sections: a sensor probe, a control PC with a user server terminal, and a mobile terminal. The sensor probe employed is a mine wireless laser methane
sensor; the device terminal is composed of a computer terminal, a mobile phone and other
mobile device terminals; the User server is used to connect the sensor to the computer terminal/mobile phone; GPRS is employed to communicate between sensor probe and the other
terminals to achieve the real-time gas concentration monitoring.
Figure 1. System block diagram.
Sensor
1~1
GPRS/ 3G/ 4G
I~
r=Yens~~C NB-IoT ~~
Network
Sensor
1~1
LoRa WAN
I ~
Communication
module
Sensor
1 ~1
WiFi
I ~
Sensor
1~1
LAN
I~
G
E
t
t