

44
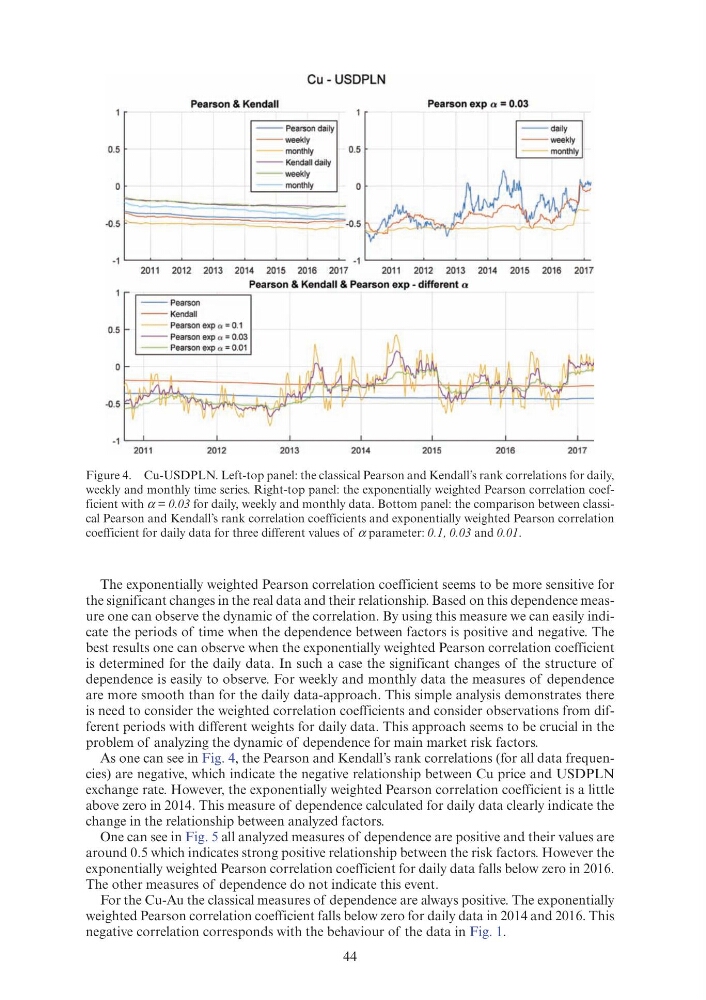
The exponentially weighted Pearson correlation coefficient seems to be more sensitive for
the significant changes in the real data and their relationship. Based on this dependence measure one can observe the dynamic of the correlation. By using this measure we can easily indicate the periods of time when the dependence between factors is positive and negative. The
best results one can observe when the exponentially weighted Pearson correlation coefficient
is determined for the daily data. In such a case the significant changes of the structure of
dependence is easily to observe. For weekly and monthly data the measures of dependence
are more smooth than for the daily data-approach. This simple analysis demonstrates there
is need to consider the weighted correlation coefficients and consider observations from different periods with different weights for daily data. This approach seems to be crucial in the
problem of analyzing the dynamic of dependence for main market risk factors.
As one can see in Fig. 4, the Pearson and Kendall’s rank correlations (for all data frequencies) are negative, which indicate the negative relationship between Cu price and USDPLN
exchange rate. However, the exponentially weighted Pearson correlation coefficient is a little
above zero in 2014. This measure of dependence calculated for daily data clearly indicate the
change in the relationship between analyzed factors.
One can see in Fig. 5 all analyzed measures of dependence are positive and their values are
around 0.5 which indicates strong positive relationship between the risk factors. However the
exponentially weighted Pearson correlation coefficient for daily data falls below zero in 2016.
The other measures of dependence do not indicate this event.
For the Cu-Au the classical measures of dependence are always positive. The exponentially
weighted Pearson correlation coefficient falls below zero for daily data in 2014 and 2016. This
negative correlation corresponds with the behaviour of the data in Fig. 1.
Figure 4. Cu-USDPLN. Left-top panel: the classical Pearson and Kendall’s rank correlations for daily,
weekly and monthly time series. Right-top panel: the exponentially weighted Pearson correlation coefficient with α = 0.03 for daily, weekly and monthly data. Bottom panel: the comparison between classical Pearson and Kendall’s rank correlation coefficients and exponentially weighted Pearson correlation
coefficient for daily data for three different values of α parameter: 0.1, 0.03 and 0.01.
Cu- USDPLN
Pearson & Kendall
Pearson exp a = 0.03
- - Pearson daily
- - weekly
0.5
+ - - monthly
0.5
- - Kendall daily
- - weekly
- - monthly
·1 L--~-~-~--~-~--~-~ -1 L--~-~--~-~-~--~-~
2011
2012 2013 2014 2015 2016 2017
2011
2012 2013 201 4
2015 2016 2017
Pearson & Kendall & Pearson exp -different a
- - Pearson
- - Kendall
0.5
- - Pearson exp a = 0.1
- - Pearson exp o: = 0.03
- - Pearson exp a = 0.01
-1L-~---------L---------L---------L--------~---------L---------L2011
20 12
2013
2014
2015
2016
2017
The exponentially weighted Pearson correlation coefficient seems to be more sensitive for
the significant changes in the real data and their relationship. Based on this dependence measure one can observe the dynamic of the correlation. By using this measure we can easily indicate the periods of time when the dependence between factors is positive and negative. The
best results one can observe when the exponentially weighted Pearson correlation coefficient
is determined for the daily data. In such a case the significant changes of the structure of
dependence is easily to observe. For weekly and monthly data the measures of dependence
are more smooth than for the daily data-approach. This simple analysis demonstrates there
is need to consider the weighted correlation coefficients and consider observations from different periods with different weights for daily data. This approach seems to be crucial in the
problem of analyzing the dynamic of dependence for main market risk factors.
As one can see in Fig. 4, the Pearson and Kendall’s rank correlations (for all data frequencies) are negative, which indicate the negative relationship between Cu price and USDPLN
exchange rate. However, the exponentially weighted Pearson correlation coefficient is a little
above zero in 2014. This measure of dependence calculated for daily data clearly indicate the
change in the relationship between analyzed factors.
One can see in Fig. 5 all analyzed measures of dependence are positive and their values are
around 0.5 which indicates strong positive relationship between the risk factors. However the
exponentially weighted Pearson correlation coefficient for daily data falls below zero in 2016.
The other measures of dependence do not indicate this event.
For the Cu-Au the classical measures of dependence are always positive. The exponentially
weighted Pearson correlation coefficient falls below zero for daily data in 2014 and 2016. This
negative correlation corresponds with the behaviour of the data in Fig. 1.
Figure 4. Cu-USDPLN. Left-top panel: the classical Pearson and Kendall’s rank correlations for daily,
weekly and monthly time series. Right-top panel: the exponentially weighted Pearson correlation coefficient with α = 0.03 for daily, weekly and monthly data. Bottom panel: the comparison between classical Pearson and Kendall’s rank correlation coefficients and exponentially weighted Pearson correlation
coefficient for daily data for three different values of α parameter: 0.1, 0.03 and 0.01.
Cu- USDPLN
Pearson & Kendall
Pearson exp a = 0.03
- - Pearson daily
- - weekly
0.5
+ - - monthly
0.5
- - Kendall daily
- - weekly
- - monthly
·1 L--~-~-~--~-~--~-~ -1 L--~-~--~-~-~--~-~
2011
2012 2013 2014 2015 2016 2017
2011
2012 2013 201 4
2015 2016 2017
Pearson & Kendall & Pearson exp -different a
- - Pearson
- - Kendall
0.5
- - Pearson exp a = 0.1
- - Pearson exp o: = 0.03
- - Pearson exp a = 0.01
-1L-~---------L---------L---------L--------~---------L---------L2011
20 12
2013
2014
2015
2016
2017