

625
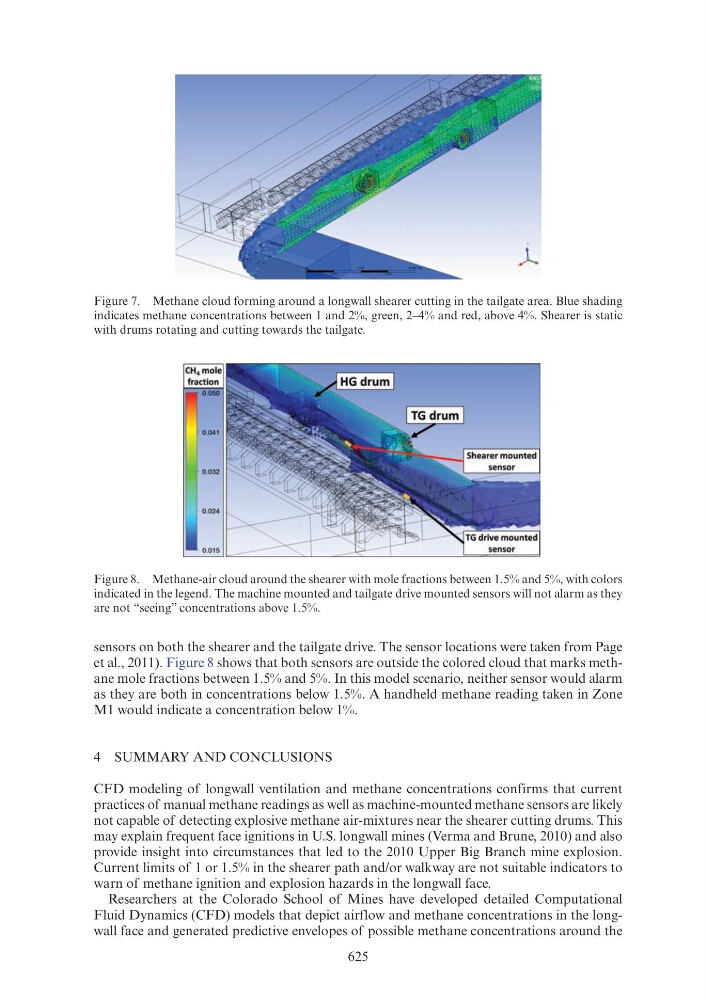
Figure 7. Methane cloud forming around a longwall shearer cutting in the tailgate area. Blue shading
indicates methane concentrations between 1 and 2%, green, 2–4% and red, above 4%. Shearer is static
with drums rotating and cutting towards the tailgate.
Figure 8. Methane-air cloud around the shearer with mole fractions between 1.5% and 5%, with colors
indicated in the legend. The machine mounted and tailgate drive mounted sensors will not alarm as they
are not “seeing” concentrations above 1.5%.
sensors on both the shearer and the tailgate drive. The sensor locations were taken from Page
et al., 2011). Figure 8 shows that both sensors are outside the colored cloud that marks methane mole fractions between 1.5% and 5%. In this model scenario, neither sensor would alarm
as they are both in concentrations below 1.5%. A handheld methane reading taken in Zone
M1 would indicate a concentration below 1%.
4 SUMMARY AND CONCLUSIONS
CFD modeling of longwall ventilation and methane concentrations confirms that current
practices of manual methane readings as well as machine-mounted methane sensors are likely
not capable of detecting explosive methane air-mixtures near the shearer cutting drums. This
may explain frequent face ignitions in U.S. longwall mines (Verma and Brune, 2010) and also
provide insight into circumstances that led to the 2010 Upper Big Branch mine explosion.
Current limits of 1 or 1.5% in the shearer path and/or walkway are not suitable indicators to
warn of methane ignition and explosion hazards in the longwall face.
Researchers at the Colorado School of Mines have developed detailed Computational
Fluid Dynamics (CFD) models that depict airflow and methane concentrations in the longwall face and generated predictive envelopes of possible methane concentrations around the