

41
sections of time what can mean that one may suspect there is a strong relationship between
the presented market risk factors. Thus in the next section we examine the real time series
in the context of their dependence dynamic expressed in the terms of different measures of
dependence. The relationship between the main risk factors will be analysed as a function
of time. Therefore one can observe the significant changes of the risk factors (caused by
changes on the market) influence the changes of the relationship between them.
3 MEASURING THE RELATIONSHIP BETWEEN MAIN MARKET
RISK FACTORS OF KGHM CAPITAL GROUP
As it was mentioned, in this section we analyze the relationship between the main market
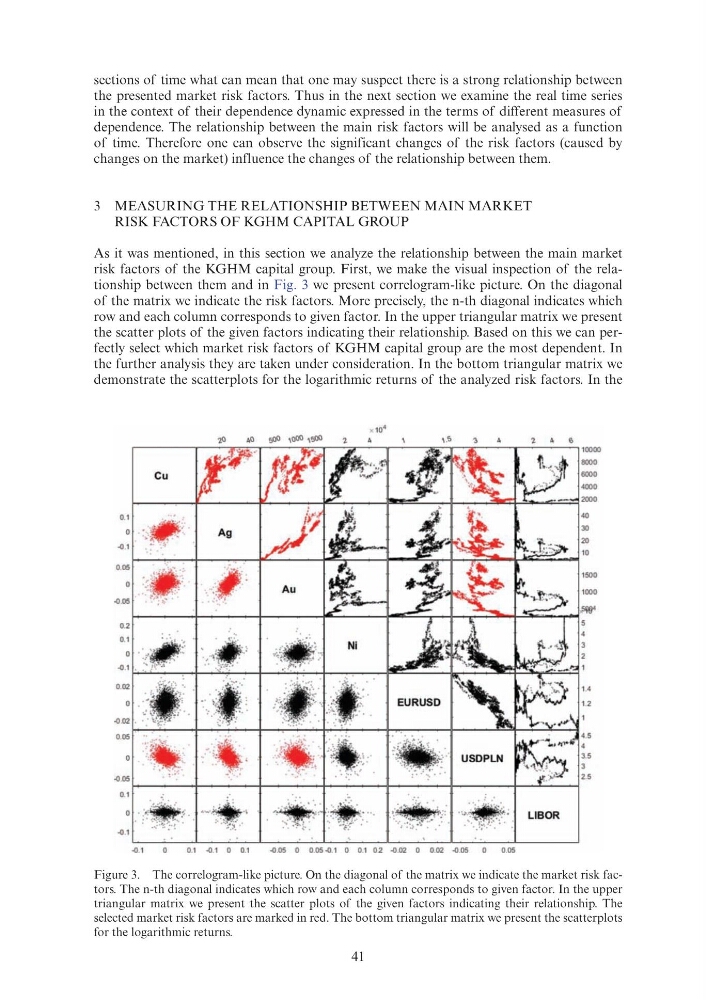
risk factors of the KGHM capital group. First, we make the visual inspection of the relationship between them and in Fig. 3 we present correlogram-like picture. On the diagonal
of the matrix we indicate the risk factors. More precisely, the n-th diagonal indicates which
row and each column corresponds to given factor. In the upper triangular matrix we present
the scatter plots of the given factors indicating their relationship. Based on this we can perfectly select which market risk factors of KGHM capital group are the most dependent. In
the further analysis they are taken under consideration. In the bottom triangular matrix we
demonstrate the scatterplots for the logarithmic returns of the analyzed risk factors. In the
Figure 3. The correlogram-like picture. On the diagonal of the matrix we indicate the market risk factors. The n-th diagonal indicates which row and each column corresponds to given factor. In the upper
triangular matrix we present the scatter plots of the given factors indicating their relationship. The
selected market risk factors are marked in red. The bottom triangular matrix we present the scatterplots
for the logarithmic returns.
\ ,0
Cu
0.1
.().1
0.05
LIB OR
.().1
0.1 .().1 0 0.1
.().05 0 0 .05.().1 0 0.1 02 .().02 0 0.02 .().05
0 .05
sections of time what can mean that one may suspect there is a strong relationship between
the presented market risk factors. Thus in the next section we examine the real time series
in the context of their dependence dynamic expressed in the terms of different measures of
dependence. The relationship between the main risk factors will be analysed as a function
of time. Therefore one can observe the significant changes of the risk factors (caused by
changes on the market) influence the changes of the relationship between them.
3 MEASURING THE RELATIONSHIP BETWEEN MAIN MARKET
RISK FACTORS OF KGHM CAPITAL GROUP
As it was mentioned, in this section we analyze the relationship between the main market
risk factors of the KGHM capital group. First, we make the visual inspection of the relationship between them and in Fig. 3 we present correlogram-like picture. On the diagonal
of the matrix we indicate the risk factors. More precisely, the n-th diagonal indicates which
row and each column corresponds to given factor. In the upper triangular matrix we present
the scatter plots of the given factors indicating their relationship. Based on this we can perfectly select which market risk factors of KGHM capital group are the most dependent. In
the further analysis they are taken under consideration. In the bottom triangular matrix we
demonstrate the scatterplots for the logarithmic returns of the analyzed risk factors. In the
Figure 3. The correlogram-like picture. On the diagonal of the matrix we indicate the market risk factors. The n-th diagonal indicates which row and each column corresponds to given factor. In the upper
triangular matrix we present the scatter plots of the given factors indicating their relationship. The
selected market risk factors are marked in red. The bottom triangular matrix we present the scatterplots
for the logarithmic returns.
\ ,0
Cu
0.1
.().1
0.05
LIB OR
.().1
0.1 .().1 0 0.1
.().05 0 0 .05.().1 0 0.1 02 .().02 0 0.02 .().05
0 .05