

548
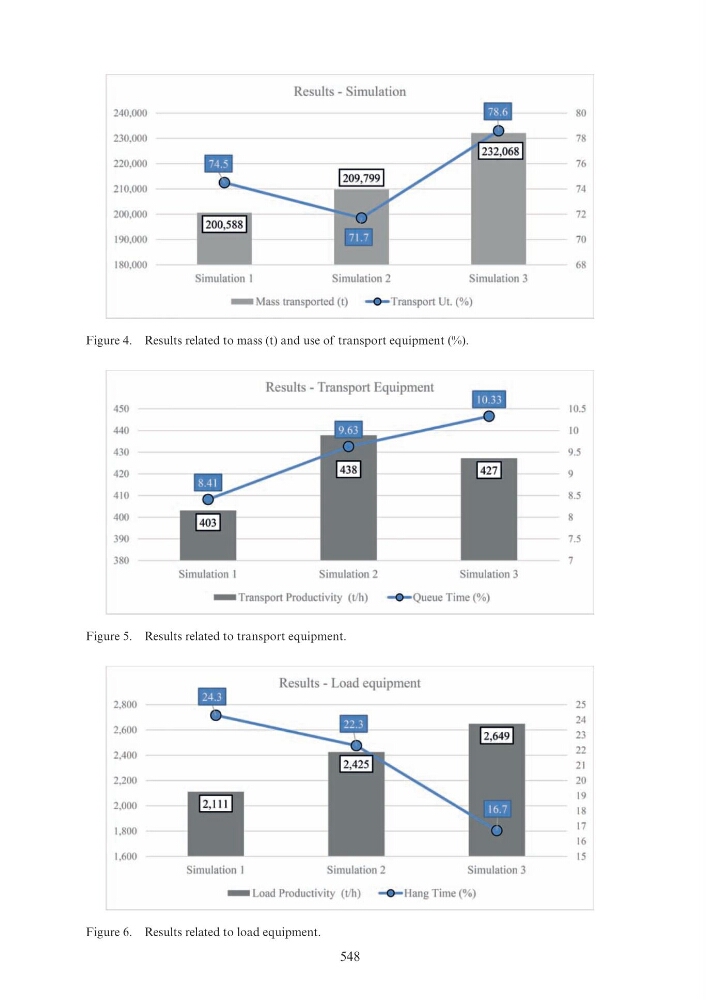
Figure 4. Results related to mass (t) and use of transport equipment (%).
Figure 5. Results related to transport equipment.
Figure 6. Results related to load equipment.
Results - Simulation
240,000
80
230,000
78
220,000
76
210,000
74
200,000
1200,5881
72
190,000
70
180,000
_ ....._
68
Simulation 1
Simulation 2
Simulation 3
-
Mass transported (t) - -Transport Ut. (%)
Results - Transport Equipment
1111
450
10.5
440
10
430
9.5
420
9
410
8.5
400
8
390
7.5
3XO
7
Simulation I
Simulation 2
Simulation 3
-Transport Productivity (t/h)
- -Queue Time(%)
Results - Load equipment
2,800
25
24
2,600
23
2,400
22
21
2,200
20
19
2,000
18
I,XOO
17
16
1,600
15
Simulation I
Simulation 2
Simulation 3
-Load Productivity (t/h)
- -Hang Time(%)