

540
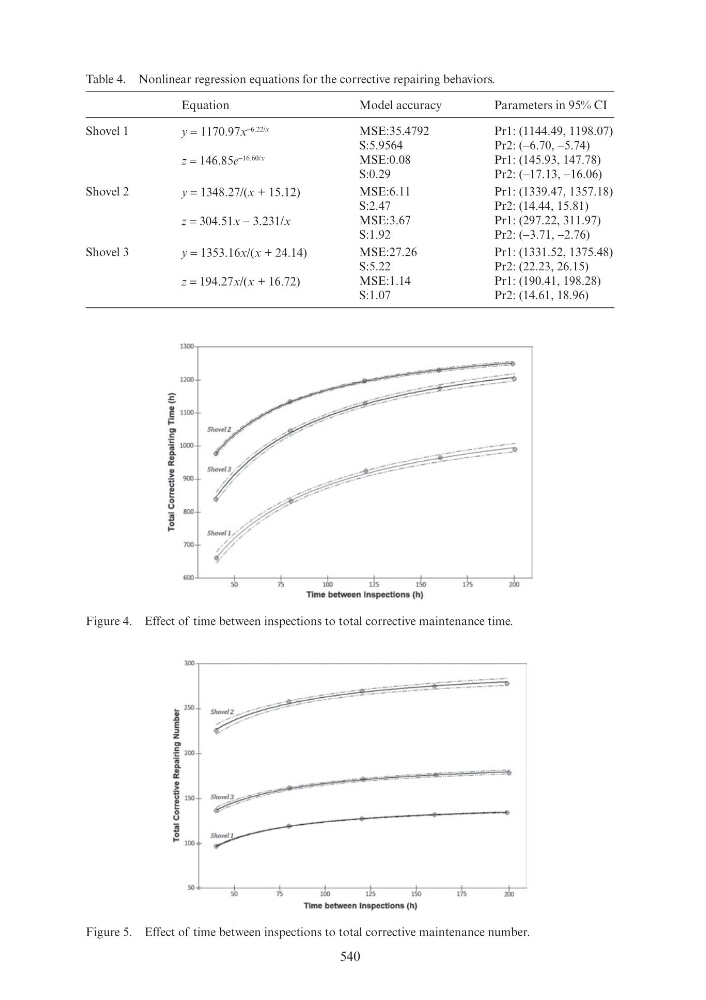
Table 4. Nonlinear regression equations for the corrective repairing behaviors.
Equation
Model accuracy
Parameters in 95% CI
Shovel 1
y = 1170.97x
−6.22/x
MSE:35.4792
S:5.9564
Pr1: (1144.49, 1198.07)
Pr2: (−6.70, −5.74)
z = 146.85e
−16.60/x
MSE:0.08
S:0.29
Pr1: (145.93, 147.78)
Pr2: (−17.13, −16.06)
Shovel 2
y = 1348.27/(x + 15.12)
MSE:6.11
S:2.47
Pr1: (1339.47, 1357.18)
Pr2: (14.44, 15.81)
z = 304.51x − 3.231/x
MSE:3.67
S:1.92
Pr1: (297.22, 311.97)
Pr2: (−3.71, −2.76)
Shovel 3
y = 1353.16x/(x + 24.14)
MSE:27.26
S:5.22
Pr1: (1331.52, 1375.48)
Pr2: (22.23, 26.15)
z = 194.27x/(x + 16.72)
MSE:1.14
S:1.07
Pr1: (190.41, 198.28)
Pr2: (14.61, 18.96)
Figure 4. Effect of time between inspections to total corrective maintenance time.
Figure 5. Effect of time between inspections to total corrective maintenance number.
1300,------------------------------------------------------------,
1200
g:
~ 1100
F=
"' c
i lCXXJ
D.
~
!l! 900
~ 0
u
!
800
Shove/3 - .
. / /
/ /
t'/'
./-;.::>·
Shovel~/··;./··
700
/ /
1/
,-·
.'"""_....··
600~-----,to-------j7s~------ 1too ~-----1i2~s------~ 1t ~-------1i 7~ s ------~ 2oo~_j
Time between Inspections (h)
~ -----------------------------------------------------------,
._ 250
u
.D
E
"
z
"'
-E 200
i u
"' u >
t; 150
!!
0
u
! 100
::=:::=:::::::=::=:::=·
____ ::=::::::::=:.
~~----~~ t-----~7± ,-------1ioo ~-----j 12~,------~------~1±7s ~----~ 200 t-~
Time between Inspections (h)