

539
elimination of regular inspections from maintenance policies or increasing the inspection
intervals might cause a remarkable jump in the deterioration and failure rates of components
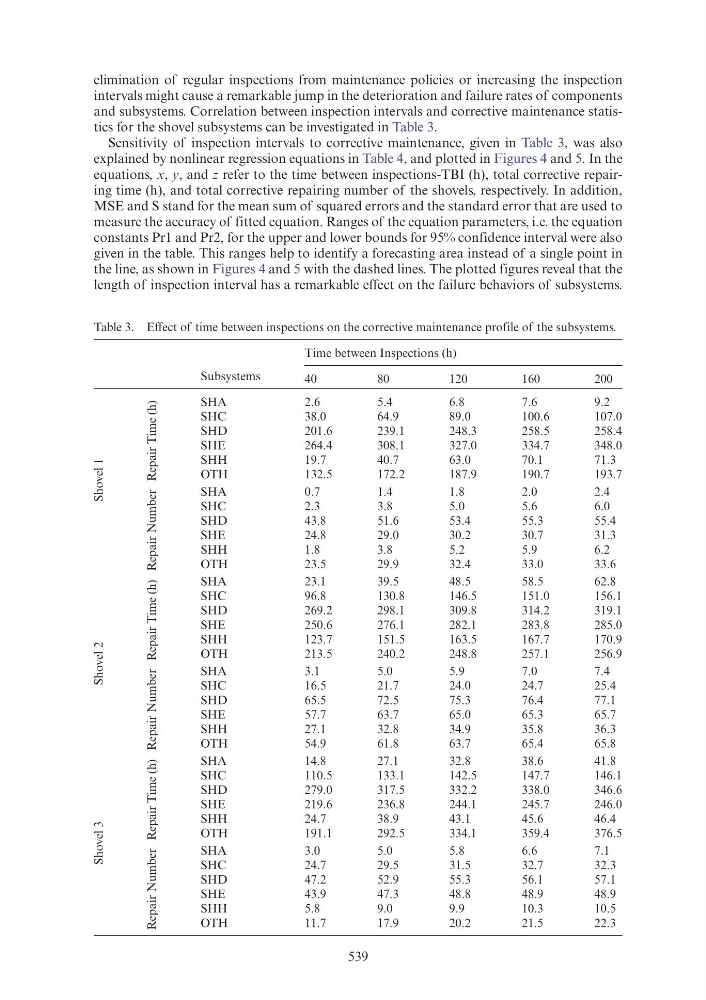
and subsystems. Correlation between inspection intervals and corrective maintenance statistics for the shovel subsystems can be investigated in Table 3.
Sensitivity of inspection intervals to corrective maintenance, given in Table 3, was also
explained by nonlinear regression equations in Table 4, and plotted in Figures 4 and 5. In the
equations, x, y, and z refer to the time between inspections-TBI (h), total corrective repairing time (h), and total corrective repairing number of the shovels, respectively. In addition,
MSE and S stand for the mean sum of squared errors and the standard error that are used to
measure the accuracy of fitted equation. Ranges of the equation parameters, i.e. the equation
constants Pr1 and Pr2, for the upper and lower bounds for 95% confidence interval were also
given in the table. This ranges help to identify a forecasting area instead of a single point in
the line, as shown in Figures 4 and 5 with the dashed lines. The plotted figures reveal that the
length of inspection interval has a remarkable effect on the failure behaviors of subsystems.
Table 3. Effect of time between inspections on the corrective maintenance profile of the subsystems.
Subsystems
Time between Inspections (h)
40
80
120
160
200
Shovel 1
Repair Time (h)
SHA
2.6
5.4
6.8
7.6
9.2
SHC
38.0
64.9
89.0
100.6
107.0
SHD
201.6
239.1
248.3
258.5
258.4
SHE
264.4
308.1
327.0
334.7
348.0
SHH
19.7
40.7
63.0
70.1
71.3
OTH
132.5
172.2
187.9
190.7
193.7
Repair Number
SHA
0.7
1.4
1.8
2.0
2.4
SHC
2.3
3.8
5.0
5.6
6.0
SHD
43.8
51.6
53.4
55.3
55.4
SHE
24.8
29.0
30.2
30.7
31.3
SHH
1.8
3.8
5.2
5.9
6.2
OTH
23.5
29.9
32.4
33.0
33.6
Shovel 2
Repair Time (h)
SHA
23.1
39.5
48.5
58.5
62.8
SHC
96.8
130.8
146.5
151.0
156.1
SHD
269.2
298.1
309.8
314.2
319.1
SHE
250.6
276.1
282.1
283.8
285.0
SHH
123.7
151.5
163.5
167.7
170.9
OTH
213.5
240.2
248.8
257.1
256.9
Repair Number
SHA
3.1
5.0
5.9
7.0
7.4
SHC
16.5
21.7
24.0
24.7
25.4
SHD
65.5
72.5
75.3
76.4
77.1
SHE
57.7
63.7
65.0
65.3
65.7
SHH
27.1
32.8
34.9
35.8
36.3
OTH
54.9
61.8
63.7
65.4
65.8
Shovel 3
Repair Time (h)
SHA
14.8
27.1
32.8
38.6
41.8
SHC
110.5
133.1
142.5
147.7
146.1
SHD
279.0
317.5
332.2
338.0
346.6
SHE
219.6
236.8
244.1
245.7
246.0
SHH
24.7
38.9
43.1
45.6
46.4
OTH
191.1
292.5
334.1
359.4
376.5
Repair Number
SHA
3.0
5.0
5.8
6.6
7.1
SHC
24.7
29.5
31.5
32.7
32.3
SHD
47.2
52.9
55.3
56.1
57.1
SHE
43.9
47.3
48.8
48.9
48.9
SHH
5.8
9.0
9.9
10.3
10.5
OTH
11.7
17.9
20.2
21.5
22.3