

521
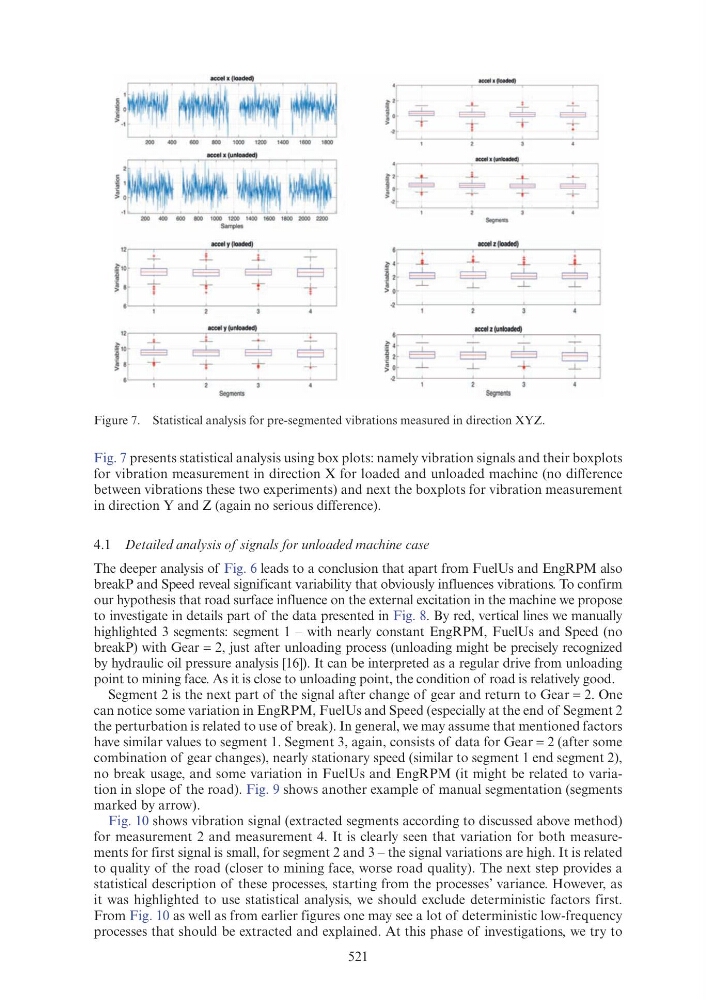
Fig. 7 presents statistical analysis using box plots: namely vibration signals and their boxplots
for vibration measurement in direction X for loaded and unloaded machine (no difference
between vibrations these two experiments) and next the boxplots for vibration measurement
in direction Y and Z (again no serious difference).
4.1 Detailed analysis of signals for unloaded machine case
The deeper analysis of Fig. 6 leads to a conclusion that apart from FuelUs and EngRPM also
breakP and Speed reveal significant variability that obviously influences vibrations. To confirm
our hypothesis that road surface influence on the external excitation in the machine we propose
to investigate in details part of the data presented in Fig. 8. By red, vertical lines we manually
highlighted 3 segments: segment 1 – with nearly constant EngRPM, FuelUs and Speed (no
breakP) with Gear = 2, just after unloading process (unloading might be precisely recognized
by hydraulic oil pressure analysis [16]). It can be interpreted as a regular drive from unloading
point to mining face. As it is close to unloading point, the condition of road is relatively good.
Segment 2 is the next part of the signal after change of gear and return to Gear = 2. One
can notice some variation in EngRPM, FuelUs and Speed (especially at the end of Segment 2
the perturbation is related to use of break). In general, we may assume that mentioned factors
have similar values to segment 1. Segment 3, again, consists of data for Gear = 2 (after some
combination of gear changes), nearly stationary speed (similar to segment 1 end segment 2),
no break usage, and some variation in FuelUs and EngRPM (it might be related to variation in slope of the road). Fig. 9 shows another example of manual segmentation (segments
marked by arrow).
Fig. 10 shows vibration signal (extracted segments according to discussed above method)
for measurement 2 and measurement 4. It is clearly seen that variation for both measurements for first signal is small, for segment 2 and 3 – the signal variations are high. It is related
to quality of the road (closer to mining face, worse road quality). The next step provides a
statistical description of these processes, starting from the processes’ variance. However, as
it was highlighted to use statistical analysis, we should exclude deterministic factors first.
From Fig. 10 as well as from earlier figures one may see a lot of deterministic low-frequency
processes that should be extracted and explained. At this phase of investigations, we try to
Figure 7. Statistical analysis for pre-segmented vibrations measured in direction XYZ.
accel x (loaded)
1 1~ + + +I
'
----:----~
!j+ +· -+ +i
1
2
3
•
Segments
f:11" +·~·+ ~ I
6
1
2
3
4
j l4 ~·-~ ~ 1
1
2
3
4
, : ~1 + f·-+ ~ I
1
2
3
4
jl~ ~·- ~ $j
1
2
3
4
Segments
Segmen~